
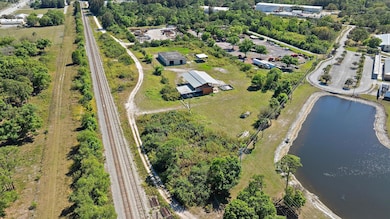
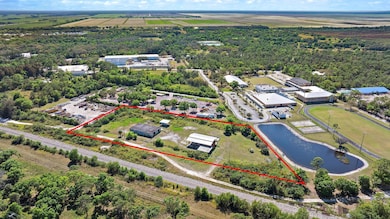


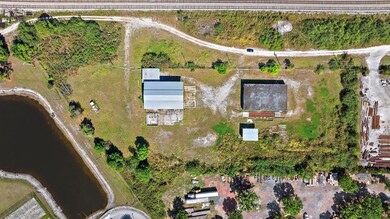

15803 SW Farm Rd Indiantown, FL 34956
Estimated payment $12,180/month
About This Lot
3.66 acre property located in the heart of Indiantown with tons of opportunity! Permitted uses include development of 20 housing units/acre, light industrial, outside storage, manufacturing and mixed use. The owner has approval to bring in a rail spur from the railroad abutting the property. 2 metal buildings, electric, water and truck scale. 3 parcels sold together. Federal designated opportunity zone offering capital gains tax shelter for qualified businesses.
Property Details
Property Type
- Land
Est. Annual Taxes
- $5,511
Year Built
- 1969
Lot Details
- 3.66 Acre Lot
- Dirt Road
- Site Plan Filed
- Property is zoned LI
Community Details
- Indiantown Industrial Par Subdivision
Listing and Financial Details
- Assessor Parcel Number 064039001001000300
Map
Home Values in the Area
Average Home Value in this Area
Tax History
| Year | Tax Paid | Tax Assessment Tax Assessment Total Assessment is a certain percentage of the fair market value that is determined by local assessors to be the total taxable value of land and additions on the property. | Land | Improvement |
|---|---|---|---|---|
| 2024 | $4,813 | $302,786 | -- | -- |
| 2023 | $4,813 | $275,260 | $275,260 | $171,460 |
| 2022 | $2,734 | $156,870 | $56,360 | $100,510 |
| 2021 | $2,621 | $144,980 | $71,910 | $73,070 |
| 2020 | $3,174 | $139,820 | $71,900 | $67,920 |
| 2019 | $2,586 | $140,310 | $71,900 | $68,410 |
| 2018 | $2,910 | $169,140 | $101,760 | $67,380 |
| 2017 | $2,524 | $168,540 | $101,760 | $66,780 |
| 2016 | $2,163 | $130,230 | $63,320 | $66,910 |
| 2015 | -- | $113,830 | $47,470 | $66,360 |
| 2014 | -- | $95,940 | $35,000 | $60,940 |
Property History
| Date | Event | Price | Change | Sq Ft Price |
|---|---|---|---|---|
| 02/18/2025 02/18/25 | For Sale | $2,100,000 | -- | -- |
Deed History
| Date | Type | Sale Price | Title Company |
|---|---|---|---|
| Deed | $39,200 | -- |
Source: BeachesMLS
MLS Number: R11063747
APN: 06-40-39-001-001-00030-0
Disclaimer: Certain information contained herein is derived from information provided by parties other than Homes.com. All information provided is deemed reliable, but is not guaranteed to be accurate and should be independently verified.
![]() IDX information is provided exclusively for personal, non-commercial use, and may not be used for any purpose other than to identify prospective properties consumers may be interested in purchasing. Information is deemed reliable but not guaranteed.
IDX information is provided exclusively for personal, non-commercial use, and may not be used for any purpose other than to identify prospective properties consumers may be interested in purchasing. Information is deemed reliable but not guaranteed.
- 15875 SW Osceola St
- 15908 SW Indianwood Cir
- 0 SW Washington Ave
- 14681 SW Divot Dr Unit A-11
- 14671 SW Divot Dr
- 15925 SW Indianwood Cir
- 14663 SW Rake Dr
- 16372 SW Indianwood Cir
- 14642 SW Divot Dr
- 16248 SW Two Wood Way
- 14631 SW Divot Dr
- 16227 SW Two Wood Way
- 16237 SW Two Wood Way
- 16356 SW Indianwood Cir
- 16236 SW Three Wood Way
- 15960 SW Indianwood Cir Unit F-46
- 16297 SW Two Wood Way
- 16899 SW Farm Rd
- 16328 SW Indianwood Cir
- 16284 Fourwood Way
