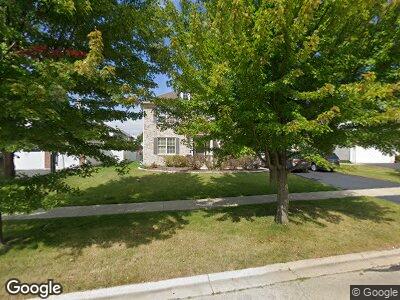
1582 Fordham St Bolingbrook, IL 60490
Freedom Park NeighborhoodEstimated Value: $495,124 - $541,000
4
Beds
3
Baths
3,145
Sq Ft
$166/Sq Ft
Est. Value
About This Home
This home is located at 1582 Fordham St, Bolingbrook, IL 60490 and is currently estimated at $522,281, approximately $166 per square foot. 1582 Fordham St is a home located in Will County with nearby schools including Liberty Elementary School, John F Kennedy Middle School, and Plainfield East High School.
Ownership History
Date
Name
Owned For
Owner Type
Purchase Details
Closed on
Feb 16, 2005
Sold by
Guarantano John D and Guarantano Diane
Bought by
Khan Asra Fatima
Current Estimated Value
Home Financials for this Owner
Home Financials are based on the most recent Mortgage that was taken out on this home.
Original Mortgage
$288,000
Interest Rate
5.93%
Mortgage Type
Fannie Mae Freddie Mac
Purchase Details
Closed on
Apr 1, 2004
Sold by
Cottrell Aimee Katz
Bought by
Guarantano Diane
Home Financials for this Owner
Home Financials are based on the most recent Mortgage that was taken out on this home.
Original Mortgage
$10,000
Interest Rate
5.85%
Mortgage Type
Credit Line Revolving
Purchase Details
Closed on
Aug 21, 2002
Sold by
Pinnacle Corp
Bought by
Cottrell Aimee Katz
Home Financials for this Owner
Home Financials are based on the most recent Mortgage that was taken out on this home.
Original Mortgage
$200,000
Interest Rate
5.62%
Create a Home Valuation Report for This Property
The Home Valuation Report is an in-depth analysis detailing your home's value as well as a comparison with similar homes in the area
Home Values in the Area
Average Home Value in this Area
Purchase History
| Date | Buyer | Sale Price | Title Company |
|---|---|---|---|
| Khan Asra Fatima | $360,000 | Burnet Title Llc | |
| Guarantano Diane | $350,000 | -- | |
| Cottrell Aimee Katz | $304,000 | Chicago Title Insurance Co |
Source: Public Records
Mortgage History
| Date | Status | Borrower | Loan Amount |
|---|---|---|---|
| Open | Khan Asra Fatima | $240,000 | |
| Previous Owner | Khan Asra Fatima | $288,000 | |
| Previous Owner | Guarantano Diane | $10,000 | |
| Previous Owner | Guarantano Diane | $329,000 | |
| Previous Owner | Cottrell Aimee Katz | $200,000 |
Source: Public Records
Tax History Compared to Growth
Tax History
| Year | Tax Paid | Tax Assessment Tax Assessment Total Assessment is a certain percentage of the fair market value that is determined by local assessors to be the total taxable value of land and additions on the property. | Land | Improvement |
|---|---|---|---|---|
| 2023 | $12,351 | $140,156 | $34,931 | $105,225 |
| 2022 | $12,351 | $126,358 | $31,492 | $94,866 |
| 2021 | $11,061 | $118,147 | $29,446 | $88,701 |
| 2020 | $10,839 | $114,262 | $28,478 | $85,784 |
| 2019 | $10,584 | $108,821 | $27,122 | $81,699 |
| 2018 | $10,665 | $108,501 | $27,042 | $81,459 |
| 2017 | $10,507 | $102,844 | $25,632 | $77,212 |
| 2016 | $10,391 | $97,900 | $24,400 | $73,500 |
| 2015 | $8,883 | $93,900 | $23,400 | $70,500 |
| 2014 | $8,883 | $92,000 | $22,900 | $69,100 |
| 2013 | $8,883 | $80,000 | $19,900 | $60,100 |
Source: Public Records
Map
Nearby Homes
- 508 Golden Star Dr
- 1518 Schafer Ave
- 1574 Farmside Ln
- 1456 Schoenherr Ave
- 1516 Parkside Dr
- 1624 Trails End Ln
- 1692 Trails End Ln Unit 6
- 1688 Trails End Ln Unit 6
- 1366 Parkside Dr
- 1898 Barrington Ave
- 1 Parkside Ct
- 1963 Norwich Ln
- 347 Clubhouse St
- 1967 Norwich Ln
- 1971 Norwich Ln
- 1 Jefferson Ct
- 1885 Bent Grass Way
- 1979 Norwich Ln
- 1983 Norwich Ln
- 1830 Snead St