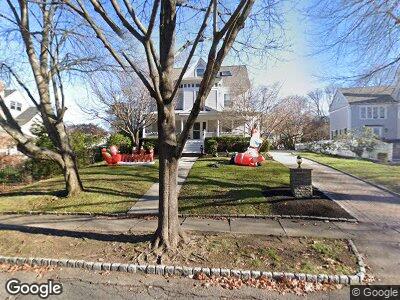
16 Brooks St Winchester, MA 01890
Grove Street NeighborhoodEstimated Value: $2,061,216 - $2,363,000
6
Beds
4
Baths
3,491
Sq Ft
$638/Sq Ft
Est. Value
About This Home
This home is located at 16 Brooks St, Winchester, MA 01890 and is currently estimated at $2,227,554, approximately $638 per square foot. 16 Brooks St is a home located in Middlesex County with nearby schools including Ambrose Elementary School, McCall Middle School, and Winchester High School.
Ownership History
Date
Name
Owned For
Owner Type
Purchase Details
Closed on
Dec 17, 2010
Sold by
Augart Laura M
Bought by
Provanzano Salvatore R and Provanzano Deborah J
Current Estimated Value
Create a Home Valuation Report for This Property
The Home Valuation Report is an in-depth analysis detailing your home's value as well as a comparison with similar homes in the area
Home Values in the Area
Average Home Value in this Area
Purchase History
| Date | Buyer | Sale Price | Title Company |
|---|---|---|---|
| Provanzano Salvatore R | $1,125,000 | -- |
Source: Public Records
Mortgage History
| Date | Status | Borrower | Loan Amount |
|---|---|---|---|
| Open | Provanzano Salvatore R | $850,000 | |
| Closed | Augart Paul T | $325,000 | |
| Closed | Augart Paul T | $200,000 | |
| Previous Owner | Augart Paul T | $525,000 | |
| Previous Owner | Augart Paul T | $202,000 |
Source: Public Records
Tax History Compared to Growth
Tax History
| Year | Tax Paid | Tax Assessment Tax Assessment Total Assessment is a certain percentage of the fair market value that is determined by local assessors to be the total taxable value of land and additions on the property. | Land | Improvement |
|---|---|---|---|---|
| 2025 | $205 | $1,845,200 | $936,600 | $908,600 |
| 2024 | $19,677 | $1,736,700 | $869,700 | $867,000 |
| 2023 | $18,391 | $1,558,600 | $802,800 | $755,800 |
| 2022 | $17,654 | $1,411,200 | $702,500 | $708,700 |
| 2021 | $39 | $1,352,600 | $643,900 | $708,700 |
| 2020 | $16,506 | $1,332,200 | $643,900 | $688,300 |
| 2019 | $14,877 | $1,228,500 | $560,300 | $668,200 |
| 2018 | $5,106 | $1,185,700 | $533,600 | $652,100 |
| 2017 | $6,733 | $1,163,200 | $533,600 | $629,600 |
| 2016 | $12,867 | $1,101,600 | $533,600 | $568,000 |
| 2015 | $12,627 | $1,040,100 | $485,000 | $555,100 |
| 2014 | $12,160 | $960,500 | $405,600 | $554,900 |
Source: Public Records
Map
Nearby Homes