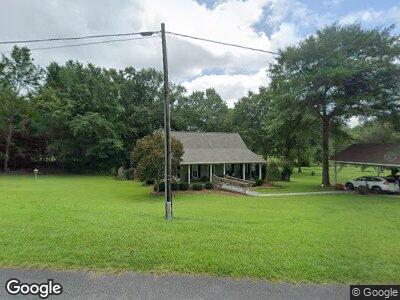
16 E Whatley St Reynolds, GA 31076
Estimated Value: $147,808 - $177,000
3
Beds
2
Baths
1,458
Sq Ft
$111/Sq Ft
Est. Value
About This Home
This home is located at 16 E Whatley St, Reynolds, GA 31076 and is currently estimated at $161,202, approximately $110 per square foot. 16 E Whatley St is a home located in Taylor County with nearby schools including Taylor County Upper Elementary School, Taylor County Primary School, and Taylor County Middle School.
Ownership History
Date
Name
Owned For
Owner Type
Purchase Details
Closed on
Dec 11, 2019
Sold by
Martin Thomas B
Bought by
Martin Aleta Joan
Current Estimated Value
Purchase Details
Closed on
May 29, 2013
Sold by
Lambert Robert W
Bought by
Martin Thomas B and Martin Aleta Joan
Purchase Details
Closed on
Jun 11, 2009
Sold by
Lambert Tosha T
Bought by
Lambert Robert W
Home Financials for this Owner
Home Financials are based on the most recent Mortgage that was taken out on this home.
Original Mortgage
$108,800
Interest Rate
4.79%
Mortgage Type
New Conventional
Purchase Details
Closed on
Nov 3, 2004
Sold by
Bell Larry C
Bought by
Lambert Ii Robert W
Purchase Details
Closed on
Nov 1, 2004
Sold by
Bell Larry C
Bought by
Lambert Robert W
Purchase Details
Closed on
Jul 15, 2003
Sold by
Knight Jonathan J
Bought by
Bell Larry C
Purchase Details
Closed on
Sep 12, 2000
Sold by
Knight Julian
Bought by
Knight Jonathan J
Create a Home Valuation Report for This Property
The Home Valuation Report is an in-depth analysis detailing your home's value as well as a comparison with similar homes in the area
Home Values in the Area
Average Home Value in this Area
Purchase History
| Date | Buyer | Sale Price | Title Company |
|---|---|---|---|
| Martin Aleta Joan | -- | -- | |
| Martin Thomas B | $110,000 | -- | |
| Lambert Robert W | -- | -- | |
| Lambert Ii Robert W | $115,000 | -- | |
| Lambert Robert W | $115,000 | -- | |
| Bell Larry C | $110,000 | -- | |
| Knight Jonathan J | $65,000 | -- |
Source: Public Records
Mortgage History
| Date | Status | Borrower | Loan Amount |
|---|---|---|---|
| Previous Owner | Lambert Robert W | $108,800 | |
| Previous Owner | Lambert Robert W | $106,900 |
Source: Public Records
Tax History Compared to Growth
Tax History
| Year | Tax Paid | Tax Assessment Tax Assessment Total Assessment is a certain percentage of the fair market value that is determined by local assessors to be the total taxable value of land and additions on the property. | Land | Improvement |
|---|---|---|---|---|
| 2024 | $2,254 | $57,640 | $4,840 | $52,800 |
| 2023 | $1,896 | $46,760 | $4,840 | $41,920 |
| 2022 | $1,121 | $44,560 | $4,840 | $39,720 |
| 2021 | $1,087 | $42,200 | $4,840 | $37,360 |
| 2020 | $1,095 | $42,200 | $4,840 | $37,360 |
| 2019 | $1,107 | $42,200 | $4,840 | $37,360 |
| 2018 | $1,323 | $38,480 | $4,840 | $33,640 |
| 2017 | $1,057 | $41,242 | $9,120 | $32,122 |
| 2016 | $1,142 | $44,371 | $9,120 | $35,251 |
| 2015 | -- | $44,371 | $9,120 | $35,251 |
| 2014 | -- | $48,246 | $8,640 | $39,606 |
| 2013 | -- | $50,643 | $10,080 | $40,563 |
Source: Public Records
Map
Nearby Homes
- 46 S Collins St
- 45 S Collins St
- 25 W Marion St
- 3 N Crawford St
- 99 Robin Hood Rd
- 1050 Whatley Pond Rd
- 0 Suggs Mill Pond Rd Unit Lot 10 11352576
- 0 Suggs Mill Pond Rd Unit Lot 9 11352575
- 0 Suggs Mill Pond Rd Unit Lot 8 11352574
- 0 Suggs Mill Pond Rd Unit Lot 6 11335731
- 0 Suggs Mill Pond Rd Unit Lot 11 11335346
- 0 Suggs Mill Pond Rd Unit Lot 7 11335342
- 0 Suggs Mill Pond Rd Unit Lot 5 11335339
- 257 Macon Rd
- 0 Hicks Rd Unit 11359864
- 0 Hicks Rd Unit 11335338
- 0 Hicks Rd Unit Lot 1B 11335336
- 0 Hicks Rd Unit Lot 1A 11335335
- 30 Potterville St
- 0 Hicks Suggs Mill Pond Rd