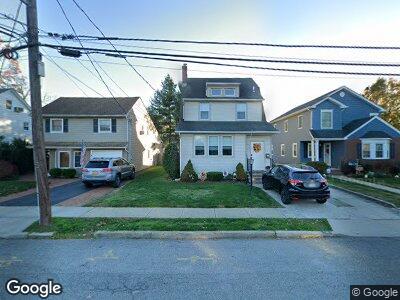
16 Saint James Place Unit LL Rockville Centre, NY 11570
Estimated Value: $820,000 - $855,344
2
Beds
1
Bath
1,494
Sq Ft
$561/Sq Ft
Est. Value
About This Home
This home is located at 16 Saint James Place Unit LL, Rockville Centre, NY 11570 and is currently estimated at $837,672, approximately $560 per square foot. 16 Saint James Place Unit LL is a home located in Nassau County with nearby schools including South Side Middle School, South Side High School, and St Agnes Cathedral School.
Ownership History
Date
Name
Owned For
Owner Type
Purchase Details
Closed on
Sep 16, 2021
Sold by
Cifarelli Joseph
Bought by
Cifarelli Joseph and Cifarelli Lorraine
Current Estimated Value
Home Financials for this Owner
Home Financials are based on the most recent Mortgage that was taken out on this home.
Original Mortgage
$484,000
Outstanding Balance
$445,176
Interest Rate
2.8%
Mortgage Type
New Conventional
Estimated Equity
$392,496
Purchase Details
Closed on
Jul 27, 2018
Sold by
Graziano Anthony
Bought by
Cifarelli Joseph
Home Financials for this Owner
Home Financials are based on the most recent Mortgage that was taken out on this home.
Original Mortgage
$424,000
Interest Rate
4.5%
Mortgage Type
New Conventional
Purchase Details
Closed on
Nov 28, 2005
Sold by
Langdon Timothy
Bought by
Graziano Anthony
Purchase Details
Closed on
Oct 24, 1997
Sold by
Madden Regina E
Bought by
Langdon Timothy
Create a Home Valuation Report for This Property
The Home Valuation Report is an in-depth analysis detailing your home's value as well as a comparison with similar homes in the area
Home Values in the Area
Average Home Value in this Area
Purchase History
| Date | Buyer | Sale Price | Title Company |
|---|---|---|---|
| Cifarelli Joseph | $605,000 | None Available | |
| Cifarelli Joseph | $530,000 | None Available | |
| Graziano Anthony | $565,000 | -- | |
| Langdon Timothy | $250,000 | -- |
Source: Public Records
Mortgage History
| Date | Status | Borrower | Loan Amount |
|---|---|---|---|
| Open | Cifarelli Joseph | $484,000 | |
| Previous Owner | Cifarelli Joseph | $50,000 | |
| Previous Owner | Cifarelli Joseph | $424,000 | |
| Previous Owner | Langdon Timothy | $232,500 |
Source: Public Records
Tax History Compared to Growth
Tax History
| Year | Tax Paid | Tax Assessment Tax Assessment Total Assessment is a certain percentage of the fair market value that is determined by local assessors to be the total taxable value of land and additions on the property. | Land | Improvement |
|---|---|---|---|---|
| 2024 | $1,210 | $560 | $226 | $334 |
| 2023 | $12,966 | $590 | $238 | $352 |
| 2022 | $12,966 | $616 | $249 | $367 |
| 2021 | $19,652 | $606 | $245 | $361 |
| 2020 | $13,520 | $795 | $641 | $154 |
| 2019 | $1,420 | $856 | $671 | $185 |
| 2018 | $1,470 | $856 | $0 | $0 |
| 2017 | $10,146 | $921 | $690 | $231 |
| 2016 | $11,528 | $937 | $690 | $247 |
| 2015 | $1,354 | $937 | $690 | $247 |
| 2014 | $1,354 | $937 | $690 | $247 |
| 2013 | $1,279 | $937 | $690 | $247 |
Source: Public Records
Map
Nearby Homes
- 302 N Forest Ave
- 29 Seaman Ave
- 221 Princeton Rd
- 12 Shepherd St
- 15 Shepherd St
- 421 N Long Beach Rd
- 56 Brower Ave
- 86 Voorhis Ave
- 12 Stratford Rd
- 30 Raymond St
- 368 Princeton Rd
- 363 Hempstead Ave
- 25 Milton Ct
- 485 S Wood Rd
- 19 Westminster Rd
- 149 Hempstead Ave
- 28 Pickwick Terrace
- 85 Gateway
- 120 Morris Ave Unit C 15
- 120 Morris Ave Unit B 16