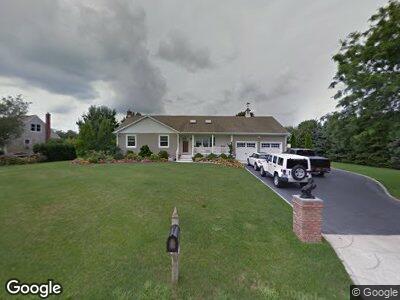
160 Crystal Dr Aquebogue, NY 11931
Jamesport NeighborhoodEstimated Value: $839,000 - $992,263
3
Beds
2
Baths
1,940
Sq Ft
$472/Sq Ft
Est. Value
About This Home
This home is located at 160 Crystal Dr, Aquebogue, NY 11931 and is currently estimated at $915,632, approximately $471 per square foot. 160 Crystal Dr is a home located in Suffolk County with nearby schools including Pulaski Street Intermediate School, Riverhead Middle School, and Riverhead Senior High School.
Ownership History
Date
Name
Owned For
Owner Type
Purchase Details
Closed on
Jan 4, 2023
Sold by
Bauer Frederick E and Bauer Denise L
Bought by
Falcone Amanda and Romeo Kyle
Current Estimated Value
Purchase Details
Closed on
Mar 23, 2015
Sold by
Marino Richard and Schellinger Christina
Bought by
Bauer Frederick E and Bauer Denise L
Home Financials for this Owner
Home Financials are based on the most recent Mortgage that was taken out on this home.
Original Mortgage
$300,000
Interest Rate
3%
Mortgage Type
New Conventional
Purchase Details
Closed on
Aug 28, 2007
Sold by
Schellinger Christina
Bought by
Schellinger Christina
Purchase Details
Closed on
Jan 28, 2003
Sold by
Davis Lynda S and Swanson Douglas J
Bought by
Swanson Elizabeth W
Purchase Details
Closed on
Apr 4, 1997
Sold by
Swanson Harry and Swanson Elizabeth W
Bought by
Davis Lynda S and Swanson Douglas J
Purchase Details
Closed on
Dec 21, 1995
Sold by
Schembri Homes Inc
Bought by
Swanson Harry and Swanson Elizabeth W
Create a Home Valuation Report for This Property
The Home Valuation Report is an in-depth analysis detailing your home's value as well as a comparison with similar homes in the area
Home Values in the Area
Average Home Value in this Area
Purchase History
| Date | Buyer | Sale Price | Title Company |
|---|---|---|---|
| Falcone Amanda | -- | Stewart Title | |
| Bauer Frederick E | $475,000 | None Available | |
| Schellinger Christina | -- | -- | |
| Swanson Elizabeth W | -- | -- | |
| Davis Lynda S | -- | Fidelity National Title Ins | |
| Swanson Harry | $158,500 | -- |
Source: Public Records
Mortgage History
| Date | Status | Borrower | Loan Amount |
|---|---|---|---|
| Previous Owner | Bauer Frederick E | $300,000 |
Source: Public Records
Tax History Compared to Growth
Tax History
| Year | Tax Paid | Tax Assessment Tax Assessment Total Assessment is a certain percentage of the fair market value that is determined by local assessors to be the total taxable value of land and additions on the property. | Land | Improvement |
|---|---|---|---|---|
| 2023 | $11,506 | $56,400 | $10,500 | $45,900 |
| 2022 | $9,277 | $52,000 | $10,500 | $41,500 |
| 2021 | $9,277 | $52,000 | $10,500 | $41,500 |
| 2020 | $9,960 | $52,000 | $10,500 | $41,500 |
| 2019 | $9,960 | $0 | $0 | $0 |
| 2018 | -- | $52,000 | $10,500 | $41,500 |
| 2017 | $9,747 | $52,000 | $10,500 | $41,500 |
| 2016 | $9,421 | $52,000 | $10,500 | $41,500 |
| 2015 | -- | $52,000 | $10,500 | $41,500 |
| 2014 | -- | $52,000 | $10,500 | $41,500 |
Source: Public Records
Map
Nearby Homes