
Seller's Agent in 2024
Lynda Le
Thread Real Estate, LLC
(617) 794-2337
14 in this area
170 Total Sales
Estimated Value: $550,000 - $587,000
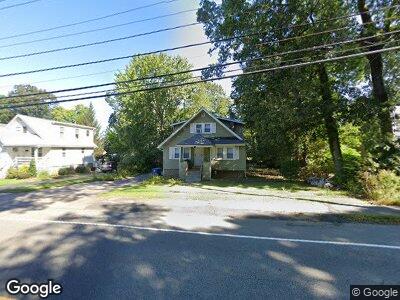
Updated single family home in Braintree Highlands for rent. This home features 4 bedrooms, 1 bathroom, and garage. Newer kitchen (est.2017), vinyl siding, new central heat (gas) and air. Upgraded 200 amp electrical service. Enter through the front door to the living and dining room. Beyond the kitchen is a sun room/breakfast nook which leads to the back deck via the sliding door. There are three bedrooms upstairs and one on the main level. Adjacent to Braintree Town Forest, a popular trail for hiking, running, and walking. Close to Thayer Sports Center. Four minutes walk to South Middle School and 14 minutes walk to Liberty Elementary School.
| Date | Buyer | Sale Price | Title Company |
|---|---|---|---|
| Smith Barbara L | $60,973 | -- | |
| Smith Barbara L | $60,973 | -- |
| Date | Status | Borrower | Loan Amount |
|---|---|---|---|
| Open | Nguyen Linda | $400,000 | |
| Closed | Smith Barbara L | $43,000 | |
| Closed | Smith Barbara L | $68,000 |
| Date | Event | Price | Change | Sq Ft Price |
|---|---|---|---|---|
| 03/01/2024 03/01/24 | Rented | $3,800 | 0.0% | -- |
| 02/04/2024 02/04/24 | Under Contract | -- | -- | -- |
| 11/19/2023 11/19/23 | For Rent | $3,800 | 0.0% | -- |
| 04/03/2023 04/03/23 | Sold | $500,000 | +16.6% | $390 / Sq Ft |
| 02/27/2023 02/27/23 | Pending | -- | -- | -- |
| 02/23/2023 02/23/23 | For Sale | $429,000 | -- | $335 / Sq Ft |
| Year | Tax Paid | Tax Assessment Tax Assessment Total Assessment is a certain percentage of the fair market value that is determined by local assessors to be the total taxable value of land and additions on the property. | Land | Improvement |
|---|---|---|---|---|
| 2025 | $5,563 | $557,400 | $321,800 | $235,600 |
| 2024 | $5,040 | $531,600 | $302,300 | $229,300 |
| 2023 | $4,786 | $490,400 | $273,100 | $217,300 |
| 2022 | $4,685 | $470,900 | $253,600 | $217,300 |
| 2021 | $4,371 | $439,300 | $234,000 | $205,300 |
| 2020 | $4,056 | $411,400 | $214,500 | $196,900 |
| 2019 | $4,011 | $397,500 | $214,500 | $183,000 |
| 2018 | $3,908 | $370,800 | $195,000 | $175,800 |
| 2017 | $3,670 | $341,700 | $175,500 | $166,200 |
| 2016 | $3,466 | $315,700 | $156,000 | $159,700 |
| 2015 | $3,339 | $301,600 | $147,300 | $154,300 |
| 2014 | $3,242 | $283,900 | $140,400 | $143,500 |
Seller's Agent in 2024
Lynda Le
Thread Real Estate, LLC
(617) 794-2337
14 in this area
170 Total Sales
H
Seller Co-Listing Agent in 2024
Hamza Abbas
Thread Real Estate, LLC
(571) 334-9628
2 in this area
23 Total Sales
S
Buyer's Agent in 2024
Sonia Hart
Common Wealth Realty Services
(617) 777-4331
8 Total Sales
Seller's Agent in 2023
Mary Beth McGillicuddy
Engel & Völkers , South Shore
(617) 216-1809
1 in this area
51 Total Sales