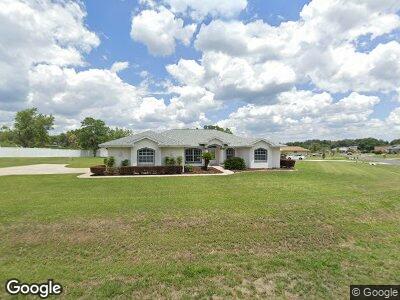
1601 N Puffin Trail Inverness, FL 34453
Estimated Value: $385,134 - $466,000
3
Beds
2
Baths
2,036
Sq Ft
$214/Sq Ft
Est. Value
About This Home
This home is located at 1601 N Puffin Trail, Inverness, FL 34453 and is currently estimated at $434,784, approximately $213 per square foot. 1601 N Puffin Trail is a home located in Citrus County with nearby schools including Hernando Elementary School, Inverness Middle School, and Citrus High School.
Ownership History
Date
Name
Owned For
Owner Type
Purchase Details
Closed on
Oct 31, 2008
Sold by
Holvoet Rudy G and Vandewalle Holvoet Katrien Y
Bought by
Eckhardt Gerrit and Bunschoten Eckhardt Hendrika E
Current Estimated Value
Purchase Details
Closed on
Dec 10, 2004
Sold by
Vanderschaft Johan
Bought by
Holvoet Rudy G and Vandewalle Holvoet Katrien Y
Home Financials for this Owner
Home Financials are based on the most recent Mortgage that was taken out on this home.
Original Mortgage
$150,000
Interest Rate
5.66%
Mortgage Type
Purchase Money Mortgage
Purchase Details
Closed on
Feb 2, 2004
Sold by
Encore Homes Inc
Bought by
Vanderschaft Johan
Home Financials for this Owner
Home Financials are based on the most recent Mortgage that was taken out on this home.
Original Mortgage
$135,000
Interest Rate
5.87%
Mortgage Type
Purchase Money Mortgage
Purchase Details
Closed on
Dec 1, 2001
Bought by
Eckhardt Gerrit and Bunschoten Eckhardt Hendrika E
Create a Home Valuation Report for This Property
The Home Valuation Report is an in-depth analysis detailing your home's value as well as a comparison with similar homes in the area
Home Values in the Area
Average Home Value in this Area
Purchase History
| Date | Buyer | Sale Price | Title Company |
|---|---|---|---|
| Eckhardt Gerrit | $242,000 | First American Title Ins Co | |
| Holvoet Rudy G | $232,000 | Advance Homestead Title | |
| Vanderschaft Johan | $193,400 | Advance Homestead Title Inc | |
| Eckhardt Gerrit | $11,400 | -- |
Source: Public Records
Mortgage History
| Date | Status | Borrower | Loan Amount |
|---|---|---|---|
| Previous Owner | Holvoet Rudy G | $150,000 | |
| Previous Owner | Vanderschaft Johan | $135,000 |
Source: Public Records
Tax History Compared to Growth
Tax History
| Year | Tax Paid | Tax Assessment Tax Assessment Total Assessment is a certain percentage of the fair market value that is determined by local assessors to be the total taxable value of land and additions on the property. | Land | Improvement |
|---|---|---|---|---|
| 2024 | $4,316 | $332,275 | $15,950 | $316,325 |
| 2023 | $4,316 | $252,039 | $0 | $0 |
| 2022 | $3,681 | $267,309 | $14,500 | $252,809 |
| 2021 | $3,149 | $210,522 | $14,500 | $196,022 |
| 2020 | $2,856 | $189,360 | $14,500 | $174,860 |
| 2019 | $2,737 | $180,998 | $14,500 | $166,498 |
| 2018 | $2,505 | $160,857 | $14,500 | $146,357 |
| 2017 | $2,561 | $160,940 | $30,090 | $130,850 |
| 2016 | $2,468 | $149,006 | $30,090 | $118,916 |
| 2015 | $2,365 | $139,243 | $30,090 | $109,153 |
| 2014 | $2,523 | $143,820 | $30,091 | $113,729 |
Source: Public Records
Map
Nearby Homes
- 4482 E Avocet Ct
- 1335 N Timucuan Trail
- 4457 E Avocet Ct
- 1286 N Timucuan Trail
- 1281 N Timucuan Trail
- 1665 N Arkansas Terrace
- 1359 N Timucuan Trail
- 4265 E Alabama Ln
- 4332 E Wyoming Ln
- 4250 E Nebraska Ln
- 1218 N Timucuan Trail
- 1329 N Foxrun Terrace
- 4308 E Texas St
- 1635 N Florida Ave
- 1455 N Paul Dr
- 1294 N Foxrun Terrace
- 1220 N Paul Dr
- 1171 N Foxrun Terrace
- 1313 N Paul Dr
- 4355 E Goodwin Ct