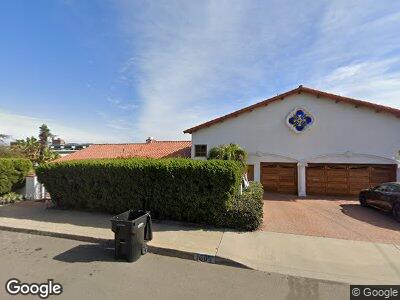
1605 Plum St San Diego, CA 92106
Roseville-Fleetridge NeighborhoodEstimated Value: $4,387,316 - $5,024,000
6
Beds
7
Baths
7,165
Sq Ft
$663/Sq Ft
Est. Value
About This Home
This home is located at 1605 Plum St, San Diego, CA 92106 and is currently estimated at $4,751,579, approximately $663 per square foot. 1605 Plum St is a home located in San Diego County with nearby schools including Richard Henry Dana Middle School, Silver Gate Elementary School, and Correia Middle School.
Ownership History
Date
Name
Owned For
Owner Type
Purchase Details
Closed on
Jul 15, 2024
Sold by
Cristiano And Evelina Da Rosa Trust and Dominguez Maureen Silva
Bought by
Kusnezov Nicholas and Kusnezov Tasha
Current Estimated Value
Home Financials for this Owner
Home Financials are based on the most recent Mortgage that was taken out on this home.
Original Mortgage
$3,825,000
Interest Rate
6.95%
Mortgage Type
VA
Purchase Details
Closed on
Mar 29, 2017
Sold by
Darosa Evelina S
Bought by
Darosa Evelina S and The Cristiano & Evelina Darosa Trust
Purchase Details
Closed on
Oct 5, 1995
Sold by
Darosa Cristiano G and Darosa Evelina S
Bought by
Darosa Cristiano G and Darosa Evelina S
Purchase Details
Closed on
May 27, 1987
Create a Home Valuation Report for This Property
The Home Valuation Report is an in-depth analysis detailing your home's value as well as a comparison with similar homes in the area
Home Values in the Area
Average Home Value in this Area
Purchase History
| Date | Buyer | Sale Price | Title Company |
|---|---|---|---|
| Kusnezov Nicholas | $4,825,000 | Fidelity National Title | |
| Darosa Evelina S | -- | None Available | |
| Darosa Cristiano G | -- | -- | |
| -- | $530,000 | -- |
Source: Public Records
Mortgage History
| Date | Status | Borrower | Loan Amount |
|---|---|---|---|
| Open | Kusnezov Nicholas | $3,819,000 | |
| Closed | Kusnezov Nicholas | $3,825,000 | |
| Previous Owner | Darosa Cristiano G | $410,000 | |
| Previous Owner | Darosa Christiano G | $3,000,000 | |
| Previous Owner | Darosa Cristiano G | $100,000 |
Source: Public Records
Tax History Compared to Growth
Tax History
| Year | Tax Paid | Tax Assessment Tax Assessment Total Assessment is a certain percentage of the fair market value that is determined by local assessors to be the total taxable value of land and additions on the property. | Land | Improvement |
|---|---|---|---|---|
| 2024 | $19,850 | $1,613,509 | $487,144 | $1,126,365 |
| 2023 | $19,413 | $1,581,873 | $477,593 | $1,104,280 |
| 2022 | $18,897 | $1,550,857 | $468,229 | $1,082,628 |
| 2021 | $18,768 | $1,520,449 | $459,049 | $1,061,400 |
| 2020 | $18,540 | $1,504,860 | $454,343 | $1,050,517 |
| 2019 | $18,209 | $1,475,354 | $445,435 | $1,029,919 |
| 2018 | $17,022 | $1,446,426 | $436,701 | $1,009,725 |
| 2017 | $80 | $1,418,066 | $428,139 | $989,927 |
| 2016 | $16,356 | $1,390,262 | $419,745 | $970,517 |
| 2015 | $16,114 | $1,369,380 | $413,441 | $955,939 |
| 2014 | $15,859 | $1,342,557 | $405,343 | $937,214 |
Source: Public Records
Map
Nearby Homes
- 1566 Evergreen St
- 3227 Lowell St
- 1561-65 Evergreen St
- 3316 Garrison St
- 3030 Jarvis St Unit 14
- 3052 Macaulay St
- 3122 Newell St
- 2909 Keats St Unit 3
- 1307 Clove St
- 3435 Dickens St
- 3503 Quimby St
- 3145 Quimby St
- 1250 Willow St
- 3228 Carleton St
- 1268-74 Locust St
- 3636 Wawona Dr
- 1933 Chatsworth Blvd
- 3733 La Cresta Dr
- 1629 Chatsworth Blvd
- 3304 Canon St