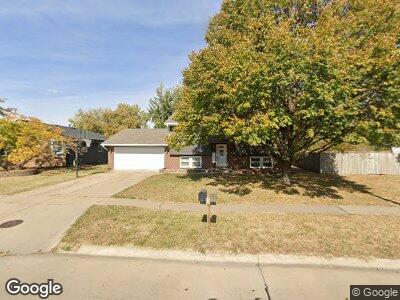
1610 NW 9th St Ankeny, IA 50023
Northwest Ankeny NeighborhoodEstimated Value: $254,000 - $338,000
2
Beds
2
Baths
930
Sq Ft
$300/Sq Ft
Est. Value
About This Home
This home is located at 1610 NW 9th St, Ankeny, IA 50023 and is currently estimated at $279,322, approximately $300 per square foot. 1610 NW 9th St is a home located in Polk County with nearby schools including Northwest Elementary School, Prairie Ridge Middle School, and Northview Middle School.
Ownership History
Date
Name
Owned For
Owner Type
Purchase Details
Closed on
Sep 20, 2007
Sold by
Chalupa Andrew R and Chalupa Kelly
Bought by
Thompson Jeffrey R and Thompson Lindsay J
Current Estimated Value
Home Financials for this Owner
Home Financials are based on the most recent Mortgage that was taken out on this home.
Original Mortgage
$157,429
Interest Rate
6.66%
Mortgage Type
FHA
Purchase Details
Closed on
Jul 2, 2001
Sold by
Leach James R and Leach Nicole C
Bought by
Chalupa Andrew R
Home Financials for this Owner
Home Financials are based on the most recent Mortgage that was taken out on this home.
Original Mortgage
$120,115
Interest Rate
7.18%
Mortgage Type
FHA
Purchase Details
Closed on
May 13, 1998
Sold by
Schwiesow Scott A and Schwiesow Jean M
Bought by
Leach James R and Leach Nicole C
Home Financials for this Owner
Home Financials are based on the most recent Mortgage that was taken out on this home.
Original Mortgage
$108,120
Interest Rate
7.25%
Mortgage Type
VA
Create a Home Valuation Report for This Property
The Home Valuation Report is an in-depth analysis detailing your home's value as well as a comparison with similar homes in the area
Home Values in the Area
Average Home Value in this Area
Purchase History
| Date | Buyer | Sale Price | Title Company |
|---|---|---|---|
| Thompson Jeffrey R | $159,500 | Itc | |
| Chalupa Andrew R | $121,500 | -- | |
| Leach James R | $105,500 | -- |
Source: Public Records
Mortgage History
| Date | Status | Borrower | Loan Amount |
|---|---|---|---|
| Open | Thompson Jeffrey R | $18,000 | |
| Open | Thompson Jeffrey | $161,782 | |
| Closed | Thompson Jeffrey R | $166,683 | |
| Closed | Thompson Jeffrey R | $159,790 | |
| Closed | Thompson Jeffrey R | $157,429 | |
| Closed | Chalupa Andrew R | $46,240 | |
| Previous Owner | Chalupa Andrew R | $230,000 | |
| Previous Owner | Chalupa Andrew R | $120,115 | |
| Previous Owner | Leach James R | $108,120 |
Source: Public Records
Tax History Compared to Growth
Tax History
| Year | Tax Paid | Tax Assessment Tax Assessment Total Assessment is a certain percentage of the fair market value that is determined by local assessors to be the total taxable value of land and additions on the property. | Land | Improvement |
|---|---|---|---|---|
| 2024 | $4,252 | $249,400 | $58,800 | $190,600 |
| 2023 | $4,298 | $249,400 | $58,800 | $190,600 |
| 2022 | $4,252 | $207,300 | $50,400 | $156,900 |
| 2021 | $4,134 | $207,300 | $50,400 | $156,900 |
| 2020 | $4,084 | $190,200 | $46,300 | $143,900 |
| 2019 | $3,942 | $190,200 | $46,300 | $143,900 |
| 2018 | $3,934 | $175,000 | $41,600 | $133,400 |
| 2017 | $3,796 | $175,000 | $41,600 | $133,400 |
| 2016 | $3,796 | $159,200 | $37,500 | $121,700 |
| 2015 | $3,796 | $159,200 | $37,500 | $121,700 |
| 2014 | $3,576 | $149,700 | $34,600 | $115,100 |
Source: Public Records
Map
Nearby Homes
- 2715 NW Cedarwood St
- 2804 NW Cedarwood Dr
- 725 NW Scott St
- 505 NW State St
- 509 NW Chapel Dr
- 1303 NW Bayview Ct
- 414 NW Chapel Dr
- 2006 NW 10th St
- 2045 NW Hickory Ln
- 1602 NW Prairie Lakes Dr Unit 1
- 513 NW Linden St
- 1122 NW Linden St
- 1202 NW Linden St
- 4710 NW 17th St
- 513 NW Scott St
- 1049 NW Greenwood St Unit 1049
- 309 NW Beechwood St
- 2005 NW 19th Ct
- 2009 NW 19th Ct
- 313 NW Bramble Rd