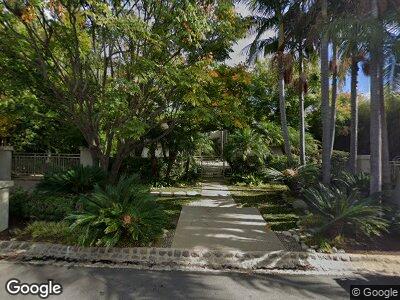
1610 San Remo Dr Pacific Palisades, CA 90272
Brentwood NeighborhoodEstimated Value: $6,073,000 - $8,601,805
5
Beds
5
Baths
5,661
Sq Ft
$1,316/Sq Ft
Est. Value
About This Home
This home is located at 1610 San Remo Dr, Pacific Palisades, CA 90272 and is currently estimated at $7,447,268, approximately $1,315 per square foot. 1610 San Remo Dr is a home located in Los Angeles County with nearby schools including Canyon Charter Elementary, Paul Revere Charter Middle School, and Palisades Charter High.
Ownership History
Date
Name
Owned For
Owner Type
Purchase Details
Closed on
Oct 16, 2023
Sold by
Newman Randall S and Newman Gretchen
Bought by
San Remo Trust and Newman
Current Estimated Value
Purchase Details
Closed on
May 2, 2018
Sold by
Newman Randall S
Bought by
Newman Randall S and Newman Gretchen
Purchase Details
Closed on
Mar 2, 1999
Sold by
Newman Randall S
Bought by
Newman Randall S and Newman Gretchen
Home Financials for this Owner
Home Financials are based on the most recent Mortgage that was taken out on this home.
Original Mortgage
$997,000
Interest Rate
6.73%
Purchase Details
Closed on
Jun 17, 1994
Sold by
Moller John J
Bought by
Newman Randall S
Home Financials for this Owner
Home Financials are based on the most recent Mortgage that was taken out on this home.
Original Mortgage
$1,000,000
Interest Rate
8.6%
Create a Home Valuation Report for This Property
The Home Valuation Report is an in-depth analysis detailing your home's value as well as a comparison with similar homes in the area
Home Values in the Area
Average Home Value in this Area
Purchase History
| Date | Buyer | Sale Price | Title Company |
|---|---|---|---|
| San Remo Trust | -- | None Listed On Document | |
| Newman Randall S | -- | None Available | |
| Newman Randall S | -- | Fidelity Title | |
| Newman Randall S | $1,745,000 | Old Republic Title | |
| Newman Randall S | -- | Old Republic Title | |
| Moller Diane | -- | Old Republic Title | |
| Moller John J | -- | Old Republic Title |
Source: Public Records
Mortgage History
| Date | Status | Borrower | Loan Amount |
|---|---|---|---|
| Previous Owner | Newman Randall S | $475,000 | |
| Previous Owner | Newman Randall S | $866,000 | |
| Previous Owner | Newman Randall S | $894,000 | |
| Previous Owner | Newman Randall S | $997,000 | |
| Previous Owner | Newman Randall S | $1,000,000 |
Source: Public Records
Tax History Compared to Growth
Tax History
| Year | Tax Paid | Tax Assessment Tax Assessment Total Assessment is a certain percentage of the fair market value that is determined by local assessors to be the total taxable value of land and additions on the property. | Land | Improvement |
|---|---|---|---|---|
| 2024 | $48,646 | $3,980,492 | $2,003,658 | $1,976,834 |
| 2023 | $47,702 | $3,902,444 | $1,964,371 | $1,938,073 |
| 2022 | $45,483 | $3,825,926 | $1,925,854 | $1,900,072 |
| 2021 | $44,926 | $3,750,909 | $1,888,093 | $1,862,816 |
| 2019 | $43,579 | $3,639,657 | $1,832,092 | $1,807,565 |
| 2018 | $43,368 | $3,568,292 | $1,796,169 | $1,772,123 |
| 2016 | $41,482 | $3,429,732 | $1,726,422 | $1,703,310 |
| 2015 | $40,873 | $3,378,215 | $1,700,490 | $1,677,725 |
| 2014 | $40,990 | $3,312,041 | $1,667,180 | $1,644,861 |
Source: Public Records
Map
Nearby Homes
- 1580 San Remo Dr
- 13215 Riviera Ranch Rd
- 1710 San Remo Dr
- 1682 San Onofre Dr
- 1600 Casale Rd
- 13574 D Este Dr
- 1550 Amalfi Dr
- 1785 Alta Mura Rd
- 1715 Westridge Rd
- 1535 Umeo Rd
- 1545 Amalfi Dr
- 1480 Capri Dr
- 1529 Amalfi Dr
- 1509 Amalfi Dr
- 1743 Westridge Rd
- 1652 Mandeville Canyon Rd
- 115 S Rockingham Ave
- 1443 Jonesboro Dr
- 1748 Correa Way
- 1756 Correa Way