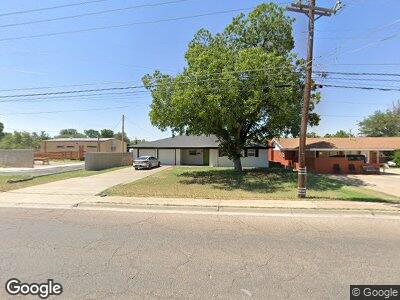
1610 W Golf Course Rd Midland, TX 79701
Estimated Value: $254,000 - $375,367
3
Beds
2
Baths
1,791
Sq Ft
$177/Sq Ft
Est. Value
About This Home
This home is located at 1610 W Golf Course Rd, Midland, TX 79701 and is currently estimated at $317,592, approximately $177 per square foot. 1610 W Golf Course Rd is a home located in Midland County with nearby schools including San Jacinto Junior High School, Midland High School, and Midland Freshman High School.
Ownership History
Date
Name
Owned For
Owner Type
Purchase Details
Closed on
Apr 14, 2023
Sold by
Duke Christopher
Bought by
Pgm Rental Properties Llc
Current Estimated Value
Home Financials for this Owner
Home Financials are based on the most recent Mortgage that was taken out on this home.
Original Mortgage
$242,080
Outstanding Balance
$231,254
Interest Rate
6.6%
Mortgage Type
Credit Line Revolving
Estimated Equity
$106,229
Purchase Details
Closed on
Apr 23, 2019
Sold by
Duke Christopher
Bought by
Duke Debbie
Home Financials for this Owner
Home Financials are based on the most recent Mortgage that was taken out on this home.
Original Mortgage
$120,000
Interest Rate
4.2%
Mortgage Type
Stand Alone First
Purchase Details
Closed on
Dec 3, 2003
Sold by
Witten Nancy Jenkins
Bought by
Duke Christopher
Purchase Details
Closed on
Jun 18, 1998
Bought by
Duke Christopher
Purchase Details
Closed on
Oct 17, 1979
Bought by
Duke Christopher
Create a Home Valuation Report for This Property
The Home Valuation Report is an in-depth analysis detailing your home's value as well as a comparison with similar homes in the area
Home Values in the Area
Average Home Value in this Area
Purchase History
| Date | Buyer | Sale Price | Title Company |
|---|---|---|---|
| Pgm Rental Properties Llc | -- | Lone Star Abstract & Title | |
| Duke Debbie | -- | Lone Star Abstract & Ttl Co | |
| Duke Christopher | -- | -- | |
| Duke Christopher | -- | -- | |
| Duke Christopher | -- | -- |
Source: Public Records
Mortgage History
| Date | Status | Borrower | Loan Amount |
|---|---|---|---|
| Open | Pgm Rental Properties Llc | $242,080 | |
| Previous Owner | Duke Christopher | $120,000 | |
| Previous Owner | Duke Debbie | $67,991 |
Source: Public Records
Tax History Compared to Growth
Tax History
| Year | Tax Paid | Tax Assessment Tax Assessment Total Assessment is a certain percentage of the fair market value that is determined by local assessors to be the total taxable value of land and additions on the property. | Land | Improvement |
|---|---|---|---|---|
| 2024 | $3,404 | $303,610 | $50,370 | $253,240 |
| 2023 | $2,962 | $274,230 | $50,370 | $223,860 |
| 2022 | $3,875 | $247,990 | $50,370 | $197,620 |
| 2021 | $4,072 | $233,750 | $50,370 | $183,380 |
| 2020 | $3,189 | $215,390 | $50,370 | $165,020 |
| 2019 | $3,987 | $210,590 | $50,370 | $165,020 |
| 2018 | $3,722 | $191,450 | $50,370 | $141,080 |
| 2017 | $3,750 | $192,880 | $50,370 | $142,510 |
| 2016 | $3,556 | $182,540 | $50,370 | $132,170 |
| 2015 | -- | $176,430 | $50,370 | $132,170 |
| 2014 | -- | $176,340 | $50,370 | $125,970 |
Source: Public Records
Map
Nearby Homes
- 1611 N K St
- 1608 N L St
- 1710 Community Ln
- 1605 N I St
- 1704 Douglas Ave
- 2007 Shell Ave
- 1602 Winfield Rd
- 2012 Community Ln
- 2011 Community Ln
- 6716 S County Road 1160 Unit A
- 2010 Douglas Ave
- 2009 Douglas Ave
- 1606 Harvard Ave
- 1607 Stanolind Ave
- 2202 Princeton Ave
- 1613 Harvard Ave
- 2008 Harvard Ave
- 1100 W Golf Course Rd
- 1207 Douglas Ave
- 1901 N Garfield St