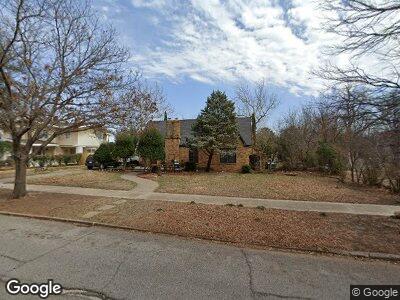
1611 Buchanan St Wichita Falls, TX 76309
West Floral Heights Historic District NeighborhoodEstimated Value: $253,000
3
Beds
3
Baths
2,317
Sq Ft
$109/Sq Ft
Est. Value
About This Home
This home is located at 1611 Buchanan St, Wichita Falls, TX 76309 and is currently estimated at $253,000, approximately $109 per square foot. 1611 Buchanan St is a home located in Wichita County with nearby schools including Crockett Elementary School, Wichita Falls High School, and Holy Family Classical Academy.
Ownership History
Date
Name
Owned For
Owner Type
Purchase Details
Closed on
Dec 29, 2022
Sold by
Green Maxie D
Bought by
Morrow Misty D
Current Estimated Value
Purchase Details
Closed on
Apr 30, 2015
Sold by
Morrow Ralph E
Bought by
Morrow Misty D
Purchase Details
Closed on
Jan 8, 2015
Sold by
Brannon Rachel and Rancher Rebecca
Bought by
Morrow Ralph E
Purchase Details
Closed on
Mar 5, 2010
Sold by
Brown Michael and Brown Karrie
Bought by
Cates Priscilla
Create a Home Valuation Report for This Property
The Home Valuation Report is an in-depth analysis detailing your home's value as well as a comparison with similar homes in the area
Home Values in the Area
Average Home Value in this Area
Purchase History
| Date | Buyer | Sale Price | Title Company |
|---|---|---|---|
| Morrow Misty D | -- | -- | |
| Morrow Misty D | -- | None Available | |
| Morrow Ralph E | -- | None Available | |
| Cates Priscilla | -- | Landmark Title Co |
Source: Public Records
Mortgage History
| Date | Status | Borrower | Loan Amount |
|---|---|---|---|
| Previous Owner | Green Maxie D | $0 |
Source: Public Records
Tax History Compared to Growth
Tax History
| Year | Tax Paid | Tax Assessment Tax Assessment Total Assessment is a certain percentage of the fair market value that is determined by local assessors to be the total taxable value of land and additions on the property. | Land | Improvement |
|---|---|---|---|---|
| 2024 | $5,149 | $221,735 | $27,004 | $194,731 |
| 2023 | $5,103 | $215,768 | $15,002 | $200,766 |
| 2022 | $5,368 | $210,403 | $15,002 | $195,401 |
| 2021 | $4,375 | $171,319 | $15,002 | $156,317 |
| 2020 | $3,887 | $150,345 | $15,002 | $135,343 |
| 2019 | $3,744 | $143,606 | $15,002 | $128,604 |
| 2018 | $3,655 | $140,205 | $15,002 | $125,203 |
| 2017 | $3,504 | $137,810 | $15,002 | $122,808 |
| 2016 | $3,380 | $132,932 | $15,002 | $117,930 |
| 2015 | $9,987 | $132,718 | $15,002 | $117,716 |
| 2014 | $9,987 | $132,718 | $0 | $0 |
Source: Public Records
Map
Nearby Homes