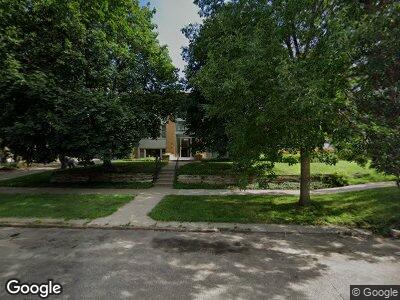
1612 F St Lincoln, NE 68508
Near South Neighborhood
2
Beds
--
Bath
900
Sq Ft
0.33
Acres
About This Home
Please search for "1525 F St Apartment Tour" on YT to see our listing!
For questions please call Mike any day (7 days a week) between the hours of 7:30 am and 9:00 pm at the number indicated in the "Contacts" tab.
Ownership History
Date
Name
Owned For
Owner Type
Purchase Details
Closed on
Jul 31, 2018
Sold by
Dean C Michael
Bought by
Dean Investments Llc
Purchase Details
Closed on
Jul 16, 2018
Sold by
Prinz Katherine A and Prinz Thomas
Bought by
Dean Investments Llc
Purchase Details
Closed on
Jul 13, 2018
Sold by
Dean Sheila Louise
Bought by
Dean Investments Llc
Create a Home Valuation Report for This Property
The Home Valuation Report is an in-depth analysis detailing your home's value as well as a comparison with similar homes in the area
Home Values in the Area
Average Home Value in this Area
Purchase History
| Date | Buyer | Sale Price | Title Company |
|---|---|---|---|
| Dean Investments Llc | -- | None Available | |
| Dean Investments Llc | -- | None Available | |
| Dean Investments Llc | -- | None Available | |
| Dean Investments Llc | -- | None Available | |
| Dean Investments Llc | -- | None Available |
Source: Public Records
Property History
| Date | Event | Price | Change | Sq Ft Price |
|---|---|---|---|---|
| 02/04/2025 02/04/25 | Off Market | $595 | -- | -- |
| 06/11/2024 06/11/24 | Price Changed | $595 | -14.4% | $1 / Sq Ft |
| 06/07/2024 06/07/24 | Price Changed | $695 | +16.8% | $1 / Sq Ft |
| 05/30/2024 05/30/24 | Price Changed | $595 | -14.4% | $1 / Sq Ft |
| 12/30/2023 12/30/23 | For Rent | $695 | -- | -- |
Tax History Compared to Growth
Tax History
| Year | Tax Paid | Tax Assessment Tax Assessment Total Assessment is a certain percentage of the fair market value that is determined by local assessors to be the total taxable value of land and additions on the property. | Land | Improvement |
|---|---|---|---|---|
| 2024 | $8,781 | $515,400 | $70,000 | $445,400 |
| 2023 | $8,781 | $523,900 | $70,000 | $453,900 |
| 2022 | $10,142 | $508,900 | $122,500 | $386,400 |
| 2021 | $8,236 | $436,800 | $122,500 | $314,300 |
| 2020 | $6,508 | $340,600 | $122,500 | $218,100 |
| 2019 | $6,509 | $340,600 | $122,500 | $218,100 |
| 2018 | $6,538 | $340,600 | $122,500 | $218,100 |
| 2017 | $5,515 | $284,700 | $122,500 | $162,200 |
| 2016 | $5,544 | $284,700 | $70,000 | $214,700 |
| 2015 | $5,506 | $284,700 | $70,000 | $214,700 |
| 2014 | $5,030 | $258,600 | $63,000 | $195,600 |
| 2013 | -- | $258,600 | $63,000 | $195,600 |
Source: Public Records