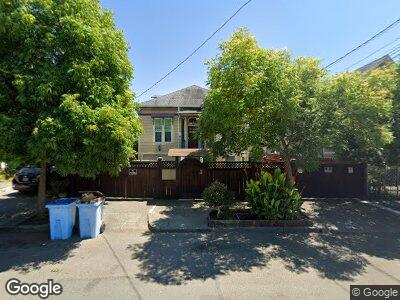
1614 Harmon St Berkeley, CA 94703
South Berkeley NeighborhoodEstimated Value: $1,209,173 - $1,558,000
7
Beds
3
Baths
3,384
Sq Ft
$396/Sq Ft
Est. Value
About This Home
This home is located at 1614 Harmon St, Berkeley, CA 94703 and is currently estimated at $1,339,043, approximately $395 per square foot. 1614 Harmon St is a home located in Alameda County with nearby schools including Malcolm X Elementary School, Emerson Elementary School, and John Muir Elementary School.
Ownership History
Date
Name
Owned For
Owner Type
Purchase Details
Closed on
Jan 8, 2003
Sold by
Zevallos Richard
Bought by
Zevallos Richard N and Zevallos Sulma
Current Estimated Value
Home Financials for this Owner
Home Financials are based on the most recent Mortgage that was taken out on this home.
Original Mortgage
$399,000
Interest Rate
5.96%
Purchase Details
Closed on
Jun 10, 1999
Sold by
Zevallos Sulma
Bought by
Zevallos Richard N
Home Financials for this Owner
Home Financials are based on the most recent Mortgage that was taken out on this home.
Original Mortgage
$231,750
Interest Rate
7.01%
Purchase Details
Closed on
Jun 3, 1999
Sold by
Ferguson John A and Cadwallader Eric C
Bought by
Zevallos Richard
Home Financials for this Owner
Home Financials are based on the most recent Mortgage that was taken out on this home.
Original Mortgage
$231,750
Interest Rate
7.01%
Create a Home Valuation Report for This Property
The Home Valuation Report is an in-depth analysis detailing your home's value as well as a comparison with similar homes in the area
Home Values in the Area
Average Home Value in this Area
Purchase History
| Date | Buyer | Sale Price | Title Company |
|---|---|---|---|
| Zevallos Richard N | -- | Financial Title Company | |
| Zevallos Richard N | -- | Chicago Title Co | |
| Zevallos Richard | $257,500 | Chicago Title Co |
Source: Public Records
Mortgage History
| Date | Status | Borrower | Loan Amount |
|---|---|---|---|
| Open | Zevallos Richard N | $563,830 | |
| Closed | Zevallos Richard N | $250,000 | |
| Closed | Zevallos Richard N | $250,000 | |
| Closed | Zevallos Richard N | $399,000 | |
| Closed | Zevallos Richard N | $57,243 | |
| Closed | Zevallos Richard N | $30,000 | |
| Closed | Zevallos Richard N | $311,500 | |
| Closed | Zevallos Richard | $231,750 |
Source: Public Records
Tax History Compared to Growth
Tax History
| Year | Tax Paid | Tax Assessment Tax Assessment Total Assessment is a certain percentage of the fair market value that is determined by local assessors to be the total taxable value of land and additions on the property. | Land | Improvement |
|---|---|---|---|---|
| 2024 | $11,638 | $388,748 | $118,801 | $276,947 |
| 2023 | $11,336 | $387,990 | $116,472 | $271,518 |
| 2022 | $10,994 | $373,384 | $114,189 | $266,195 |
| 2021 | $10,932 | $365,926 | $111,950 | $260,976 |
| 2020 | $9,990 | $369,102 | $110,802 | $258,300 |
| 2019 | $9,213 | $361,866 | $108,630 | $253,236 |
| 2018 | $8,978 | $354,772 | $106,500 | $248,272 |
| 2017 | $8,641 | $347,817 | $104,412 | $243,405 |
| 2016 | $8,113 | $340,999 | $102,366 | $238,633 |
| 2015 | $7,984 | $335,877 | $100,828 | $235,049 |
| 2014 | $8,028 | $329,298 | $98,853 | $230,445 |
Source: Public Records
Map
Nearby Homes
- 1616 Harmon St
- 1619 Fairview St
- 3324 California St
- 1622 62nd St
- 1420 Alcatraz Ave
- 3109 Sacramento St
- 1628 Tyler St
- 1507 Prince St
- 1505 Tyler St
- 1538 Ashby Ave
- 917 60th St
- 5848 Occidental St
- 731 61st St
- 3005 Harper St
- 5914 Martin Luther King jr Way
- 852 58th St
- 1533 Julia St
- 759 Alcatraz Ave
- 1028 61st St
- 980 Stanford Ave