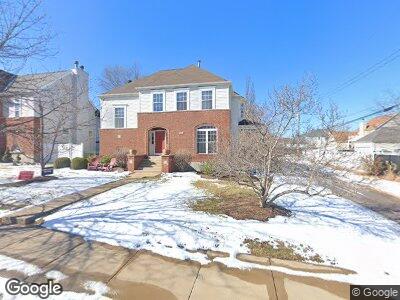
1617 Pennsylvania Ave Saint Louis, MO 63104
The Gate NeighborhoodEstimated Value: $363,000 - $448,000
--
Bed
3
Baths
2,476
Sq Ft
$162/Sq Ft
Est. Value
About This Home
This home is located at 1617 Pennsylvania Ave, Saint Louis, MO 63104 and is currently estimated at $399,949, approximately $161 per square foot. 1617 Pennsylvania Ave is a home located in St. Louis City with nearby schools including Hodgen Elementary School, Vashon High School, and New American Preparatory Academy.
Ownership History
Date
Name
Owned For
Owner Type
Purchase Details
Closed on
Mar 15, 2016
Sold by
Rosenthal Mary Sue and Gee Alison F
Bought by
Rosenthal Mary Sue and Gee Alison F
Current Estimated Value
Home Financials for this Owner
Home Financials are based on the most recent Mortgage that was taken out on this home.
Original Mortgage
$156,699
Outstanding Balance
$75,796
Interest Rate
3.65%
Mortgage Type
New Conventional
Estimated Equity
$324,216
Purchase Details
Closed on
Dec 10, 2003
Sold by
Land Reutilization Authority Of The City
Bought by
Affordable City Homes Of St Louis Inc
Purchase Details
Closed on
Oct 15, 2002
Sold by
Affordable City Homes Of St Louis Inc
Bought by
Gee Alison F and Rosenthal Mary Sue
Home Financials for this Owner
Home Financials are based on the most recent Mortgage that was taken out on this home.
Original Mortgage
$217,000
Interest Rate
6.02%
Mortgage Type
Purchase Money Mortgage
Purchase Details
Closed on
Apr 22, 2002
Sold by
Land Reutilization Authority Of The City
Bought by
Affordable City Homes Of St Louis Inc
Create a Home Valuation Report for This Property
The Home Valuation Report is an in-depth analysis detailing your home's value as well as a comparison with similar homes in the area
Home Values in the Area
Average Home Value in this Area
Purchase History
| Date | Buyer | Sale Price | Title Company |
|---|---|---|---|
| Rosenthal Mary Sue | -- | None Available | |
| Affordable City Homes Of St Louis Inc | -- | -- | |
| Gee Alison F | -- | -- | |
| Affordable City Homes Of St Louis Inc | -- | -- |
Source: Public Records
Mortgage History
| Date | Status | Borrower | Loan Amount |
|---|---|---|---|
| Open | Rosenthal Mary Sue | $156,699 | |
| Previous Owner | Gee Alison F | $217,000 |
Source: Public Records
Tax History Compared to Growth
Tax History
| Year | Tax Paid | Tax Assessment Tax Assessment Total Assessment is a certain percentage of the fair market value that is determined by local assessors to be the total taxable value of land and additions on the property. | Land | Improvement |
|---|---|---|---|---|
| 2024 | $5,107 | $63,810 | $2,850 | $60,960 |
| 2023 | $5,107 | $63,810 | $2,850 | $60,960 |
| 2022 | $4,803 | $57,770 | $2,850 | $54,920 |
| 2021 | $4,796 | $57,770 | $2,850 | $54,920 |
| 2020 | $4,536 | $55,040 | $2,850 | $52,190 |
| 2019 | $4,520 | $55,040 | $2,850 | $52,190 |
| 2018 | $3,663 | $43,170 | $2,850 | $40,320 |
| 2017 | $3,573 | $43,170 | $2,850 | $40,320 |
| 2016 | $3,026 | $36,100 | $3,420 | $32,680 |
| 2015 | $2,740 | $36,100 | $3,420 | $32,680 |
| 2014 | $1,784 | $36,100 | $3,420 | $32,680 |
| 2013 | -- | $23,520 | $3,420 | $20,100 |
Source: Public Records
Map
Nearby Homes
- 3013 Lafayette Ave
- 3007 Lafayette Ave
- 2925 Lafayette Ave
- 3120 Eads Ave
- 3208 Henrietta St
- 3224 Lafayette Ave
- 2918 Geyer Ave
- 2810 Park Ave
- 2762 Park Ave
- 3223 Geyer Ave
- 3034 Rutger St
- 3315 Park Ave
- 3309 Vista Ave
- 3319 Vista Ave
- 2802 Rutger St
- 2757 Caroline St
- 3400 Vista Ave
- 3130 Russell Blvd
- 2739 Allen Ave
- 3337 Vista Ave