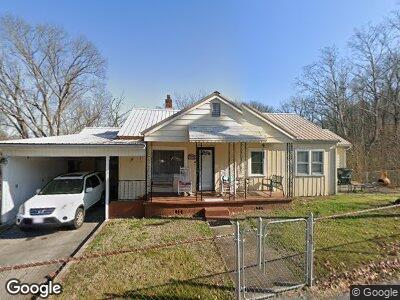
1621 Seaver Rd Kingsport, TN 37660
Estimated Value: $109,598 - $171,000
--
Bed
1
Bath
1,104
Sq Ft
$138/Sq Ft
Est. Value
About This Home
This home is located at 1621 Seaver Rd, Kingsport, TN 37660 and is currently estimated at $152,650, approximately $138 per square foot. 1621 Seaver Rd is a home located in Sullivan County with nearby schools including Sullivan Gardens K-8, St. Dominic School, and St. Paul's Day School & Kindergarten.
Create a Home Valuation Report for This Property
The Home Valuation Report is an in-depth analysis detailing your home's value as well as a comparison with similar homes in the area
Home Values in the Area
Average Home Value in this Area
Tax History Compared to Growth
Tax History
| Year | Tax Paid | Tax Assessment Tax Assessment Total Assessment is a certain percentage of the fair market value that is determined by local assessors to be the total taxable value of land and additions on the property. | Land | Improvement |
|---|---|---|---|---|
| 2024 | $433 | $17,350 | $1,900 | $15,450 |
| 2023 | $417 | $17,350 | $1,900 | $15,450 |
| 2022 | $417 | $17,350 | $1,900 | $15,450 |
| 2021 | $417 | $17,350 | $1,900 | $15,450 |
| 2020 | $432 | $17,350 | $1,900 | $15,450 |
| 2019 | $432 | $16,800 | $1,900 | $14,900 |
| 2018 | $428 | $16,800 | $1,900 | $14,900 |
| 2017 | $428 | $16,800 | $1,900 | $14,900 |
| 2016 | $382 | $14,825 | $1,900 | $12,925 |
| 2014 | $342 | $14,840 | $0 | $0 |
Source: Public Records
Map
Nearby Homes
- 209 Willowbend Ln
- 226 Willowbend Ct
- 261 Willowbend Place Unit 261
- 639 Willowcrest Place
- 2208 Princeton Rd
- 683 Willowcrest Place
- 404 Laurelwood Dr
- 0 Little Valley Rd
- 35 Willowbrook Ct
- 522 Willowbrook Trace
- 2392 Princeton Rd
- 127 Belsay Dr
- Tbd Kincaid St
- Tbd Whispering Hill Sedgefield Dr
- 2000 Mckinney Dr
- 1409 Gress Mag Mountain
- 1004 S Wilcox Dr
- 3312 Misty Dr
- 3108 Long Hollow Rd
- 0 Moreland Dr Unit 421685