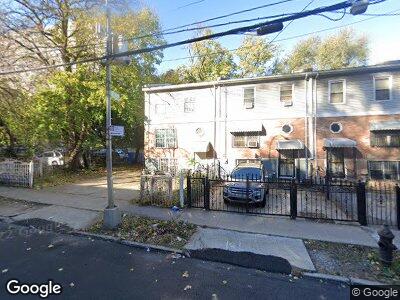
1621 Undercliff Ave Bronx, NY 10453
Morris Heights NeighborhoodEstimated Value: $631,000 - $824,000
--
Bed
--
Bath
2,350
Sq Ft
$305/Sq Ft
Est. Value
About This Home
This home is located at 1621 Undercliff Ave, Bronx, NY 10453 and is currently estimated at $716,210, approximately $304 per square foot. 1621 Undercliff Ave is a home located in Bronx County with nearby schools including P.S. 274 The New American Academy at Roberto Clemente State Park, I.S. 229 Roland Patterson, and Family Life Academy Charter School.
Ownership History
Date
Name
Owned For
Owner Type
Purchase Details
Closed on
Sep 6, 2006
Sold by
Brown Vicki and Lyons Willie M
Bought by
Brown Vicki
Current Estimated Value
Home Financials for this Owner
Home Financials are based on the most recent Mortgage that was taken out on this home.
Original Mortgage
$225,000
Interest Rate
6.31%
Mortgage Type
Purchase Money Mortgage
Purchase Details
Closed on
Jan 12, 2004
Sold by
Brown Vicki and Lyons Willie M
Bought by
Brown Vicki
Home Financials for this Owner
Home Financials are based on the most recent Mortgage that was taken out on this home.
Original Mortgage
$198,000
Interest Rate
5.6%
Mortgage Type
Purchase Money Mortgage
Purchase Details
Closed on
Feb 4, 1998
Sold by
Brown Vicki and Lyons Willie M
Bought by
Brown Vicki
Home Financials for this Owner
Home Financials are based on the most recent Mortgage that was taken out on this home.
Original Mortgage
$153,000
Interest Rate
6.9%
Create a Home Valuation Report for This Property
The Home Valuation Report is an in-depth analysis detailing your home's value as well as a comparison with similar homes in the area
Home Values in the Area
Average Home Value in this Area
Purchase History
| Date | Buyer | Sale Price | Title Company |
|---|---|---|---|
| Brown Vicki | -- | -- | |
| Brown Vicki | -- | -- | |
| Brown Vicki | -- | -- | |
| Brown Vicki | -- | -- | |
| Brown Vicki | -- | American Title Ins Co | |
| Brown Vicki | -- | American Title Ins Co |
Source: Public Records
Mortgage History
| Date | Status | Borrower | Loan Amount |
|---|---|---|---|
| Closed | Brown Vicki | $217,350 | |
| Closed | Brown Vicki | $225,000 | |
| Closed | Brown Vicki | $198,000 | |
| Closed | Brown Vicki | $37,543 | |
| Closed | Brown Vicki | $153,000 |
Source: Public Records
Tax History Compared to Growth
Tax History
| Year | Tax Paid | Tax Assessment Tax Assessment Total Assessment is a certain percentage of the fair market value that is determined by local assessors to be the total taxable value of land and additions on the property. | Land | Improvement |
|---|---|---|---|---|
| 2024 | $4,517 | $22,488 | $6,392 | $16,096 |
| 2023 | $4,309 | $21,216 | $5,533 | $15,683 |
| 2022 | $3,996 | $46,500 | $11,580 | $34,920 |
| 2021 | $4,212 | $40,500 | $11,580 | $28,920 |
| 2020 | $4,205 | $38,820 | $11,580 | $27,240 |
| 2019 | $3,920 | $32,940 | $11,580 | $21,360 |
| 2018 | $3,604 | $17,680 | $8,682 | $8,998 |
| 2017 | $3,400 | $16,680 | $11,580 | $5,100 |
| 2016 | $3,886 | $19,440 | $11,580 | $7,860 |
| 2015 | $2,454 | $19,740 | $9,660 | $10,080 |
| 2014 | $2,454 | $19,047 | $7,924 | $11,123 |
Source: Public Records
Map
Nearby Homes
- 1623 Undercliff Ave
- 130 W 175th St
- 1737 Popham Ave
- 150 Featherbed Ln Unit 4B
- 1806 Undercliff Ave
- 1847 Billingsley Terrace
- 15 Washington Terrace
- - 1 Family Home for Sale On Nelson St
- 1835 Andrews Ave S
- 1839 Andrews Ave
- 2440 Amsterdam Ave Unit 4 K
- 2440 Amsterdam Ave Unit 3 B
- 1711 Davidson Ave Unit 1N
- 396 Audubon Ave
- 1383 Plimpton Ave Unit 5B
- 382 Audubon Ave
- 546 W 188th St
- 1844 Andrews Ave
- 549 W 187th St
- 555 W 183rd St