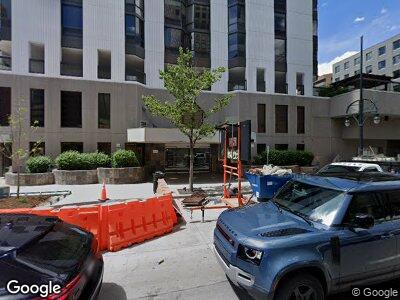
Barclay Towers 1625 Larimer St Unit 701 Denver, CO 80202
Lower Downtown NeighborhoodEstimated Value: $487,000 - $506,000
2
Beds
2
Baths
1,283
Sq Ft
$386/Sq Ft
Est. Value
About This Home
This home is located at 1625 Larimer St Unit 701, Denver, CO 80202 and is currently estimated at $494,606, approximately $385 per square foot. 1625 Larimer St Unit 701 is a home located in Denver County with nearby schools including Greenlee Elementary School, Kepner Beacon Middle School, and West High School.
Ownership History
Date
Name
Owned For
Owner Type
Purchase Details
Closed on
May 12, 2009
Sold by
Johnson Michael B and Johnson Sheila A
Bought by
Brooks Timothy James
Current Estimated Value
Home Financials for this Owner
Home Financials are based on the most recent Mortgage that was taken out on this home.
Original Mortgage
$232,500
Outstanding Balance
$150,018
Interest Rate
4.77%
Mortgage Type
Purchase Money Mortgage
Estimated Equity
$347,701
Purchase Details
Closed on
Oct 18, 1996
Sold by
Jones Carolyn R
Bought by
Johnson Michael B and Johnson Sheila A
Home Financials for this Owner
Home Financials are based on the most recent Mortgage that was taken out on this home.
Original Mortgage
$43,000
Interest Rate
8%
Mortgage Type
Seller Take Back
Create a Home Valuation Report for This Property
The Home Valuation Report is an in-depth analysis detailing your home's value as well as a comparison with similar homes in the area
Home Values in the Area
Average Home Value in this Area
Purchase History
| Date | Buyer | Sale Price | Title Company |
|---|---|---|---|
| Brooks Timothy James | $310,000 | Chicago Title Co | |
| Johnson Michael B | $169,500 | -- |
Source: Public Records
Mortgage History
| Date | Status | Borrower | Loan Amount |
|---|---|---|---|
| Open | Brooks Timothy James | $232,500 | |
| Previous Owner | Johnson Michael B | $191,750 | |
| Previous Owner | Johnson Michael B | $148,000 | |
| Previous Owner | Johnson Michael B | $152,000 | |
| Previous Owner | Johnson Michael B | $57,539 | |
| Previous Owner | Johnson Michael B | $43,000 |
Source: Public Records
Tax History Compared to Growth
Tax History
| Year | Tax Paid | Tax Assessment Tax Assessment Total Assessment is a certain percentage of the fair market value that is determined by local assessors to be the total taxable value of land and additions on the property. | Land | Improvement |
|---|---|---|---|---|
| 2024 | $2,227 | $28,120 | $3,490 | $24,630 |
| 2023 | $2,179 | $28,120 | $3,490 | $24,630 |
| 2022 | $2,210 | $27,790 | $3,620 | $24,170 |
| 2021 | $2,133 | $28,590 | $3,730 | $24,860 |
| 2020 | $2,144 | $28,900 | $3,450 | $25,450 |
| 2019 | $2,084 | $28,900 | $3,450 | $25,450 |
| 2018 | $2,126 | $27,480 | $3,210 | $24,270 |
| 2017 | $2,120 | $27,480 | $3,210 | $24,270 |
| 2016 | $2,266 | $27,790 | $2,372 | $25,418 |
| 2015 | $2,171 | $27,790 | $2,372 | $25,418 |
| 2014 | $1,759 | $21,180 | $1,966 | $19,214 |
Source: Public Records
About Barclay Towers
Map
Nearby Homes
- 1625 Larimer St Unit 2708
- 1625 Larimer St Unit 2501
- 1625 Larimer St Unit 807
- 1625 Larimer St Unit 904
- 1551 Larimer St Unit 2602
- 1551 Larimer St Unit 1402
- 1551 Larimer St Unit 1405
- 1551 Larimer St Unit 1803
- 1551 Larimer St Unit 704
- 1551 Larimer St Unit 1106
- 1551 Larimer St Unit 3106
- 1551 Larimer St Unit 2805
- 1560 Blake St Unit R810
- 1777 Larimer St Unit 2201
- 1777 Larimer St Unit 2108
- 1777 Larimer St Unit 608
- 1777 Larimer St Unit 1908
- 1777 Larimer St Unit 1608
- 1777 Larimer St Unit 808
- 1510 Wazee St Unit 3