16322 Edgemont Dr Unit 3 Fort Myers, FL 33908
Lexington Country Club NeighborhoodEstimated Value: $936,000 - $1,074,000
3
Beds
2
Baths
2,274
Sq Ft
$444/Sq Ft
Est. Value
About This Home
This home is located at 16322 Edgemont Dr Unit 3, Fort Myers, FL 33908 and is currently estimated at $1,010,412, approximately $444 per square foot. 16322 Edgemont Dr Unit 3 is a home located in Lee County with nearby schools including Allen Park Elementary School, Edison Park Creative & Expressive Arts School, and Bonita Springs Elementary School.
Ownership History
Date
Name
Owned For
Owner Type
Purchase Details
Closed on
Nov 3, 2022
Sold by
Francis J Dewey Jr Revoeable Living Trus
Bought by
8669 Properties Llc
Current Estimated Value
Purchase Details
Closed on
Sep 18, 2014
Sold by
Dewey Francis J and Dewey Francis J
Bought by
Dewey Francis J and Francis J Dewey Jr Revocable Living Trus
Purchase Details
Closed on
Jun 12, 2003
Sold by
Jordan Stephen and Jordan Donna L
Bought by
Dewey Francis J and Dewey Karen D
Home Financials for this Owner
Home Financials are based on the most recent Mortgage that was taken out on this home.
Original Mortgage
$140,000
Interest Rate
5.43%
Purchase Details
Closed on
Dec 4, 1997
Sold by
Worthingotn Com Inc
Bought by
Jordan Stephen and Jordan Donna L
Home Financials for this Owner
Home Financials are based on the most recent Mortgage that was taken out on this home.
Original Mortgage
$125,000
Interest Rate
7.38%
Create a Home Valuation Report for This Property
The Home Valuation Report is an in-depth analysis detailing your home's value as well as a comparison with similar homes in the area
Home Values in the Area
Average Home Value in this Area
Purchase History
| Date | Buyer | Sale Price | Title Company |
|---|---|---|---|
| 8669 Properties Llc | $575,000 | Heights Title | |
| Dewey Francis J | -- | Attorney | |
| Dewey Francis J | $489,900 | -- | |
| Jordan Stephen | $311,500 | -- |
Source: Public Records
Mortgage History
| Date | Status | Borrower | Loan Amount |
|---|---|---|---|
| Previous Owner | Dewey Francis J | $140,000 | |
| Previous Owner | Jordan Stephen | $125,000 |
Source: Public Records
Tax History Compared to Growth
Tax History
| Year | Tax Paid | Tax Assessment Tax Assessment Total Assessment is a certain percentage of the fair market value that is determined by local assessors to be the total taxable value of land and additions on the property. | Land | Improvement |
|---|---|---|---|---|
| 2024 | $8,579 | $167,881 | -- | -- |
| 2023 | $2,369 | $152,619 | $152,609 | $10 |
| 2022 | $7,990 | $550,375 | $131,195 | $390,761 |
| 2021 | $6,256 | $456,738 | $131,195 | $325,543 |
| 2020 | $6,264 | $449,161 | $0 | $0 |
| 2019 | $6,178 | $439,063 | $0 | $0 |
| 2018 | $6,199 | $430,876 | $0 | $0 |
| 2017 | $6,198 | $422,014 | $0 | $0 |
| 2016 | $6,194 | $461,527 | $104,700 | $356,827 |
| 2015 | $6,300 | $417,988 | $234,000 | $183,988 |
| 2014 | $6,291 | $407,203 | $224,000 | $183,203 |
| 2013 | -- | $406,316 | $190,000 | $216,316 |
Source: Public Records
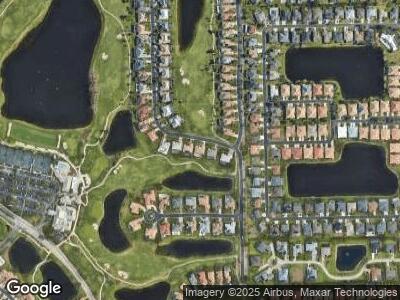
Map
Nearby Homes
- 8965 Baytowne Loop
- 16408 Edgemont Dr
- 8964 Baytowne Loop
- 16272 Edgemont Dr
- 16429 Edgemont Dr
- 9169 Garden Pointe
- 16974 Colony Lakes Blvd
- 16300 Willowcrest Way
- 17047 Colony Lakes Blvd
- 17014 Colony Lakes Blvd
- 9250 Bayberry Bend Unit 102
- 16460 Edgemont Dr
- 16110 Edgemont Dr
- 9240 Bayberry Bend Unit 103
- 16820 Colony Lakes Blvd
- 16620 Wellington Lakes Cir
- 16124 Edgemont Dr
- 9209 Garden Pointe
- 16804 Colony Lakes Blvd
- 8872 King Henry Ct