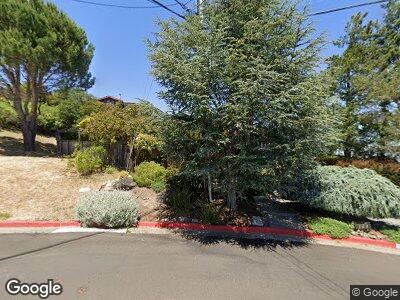
164 Oak Springs Dr San Anselmo, CA 94960
Estimated Value: $1,475,000 - $1,762,000
4
Beds
2
Baths
2,280
Sq Ft
$710/Sq Ft
Est. Value
About This Home
This home is located at 164 Oak Springs Dr, San Anselmo, CA 94960 and is currently estimated at $1,619,228, approximately $710 per square foot. 164 Oak Springs Dr is a home located in Marin County with nearby schools including Hidden Valley Elementary School, White Hill Middle School, and Archie Williams High School.
Ownership History
Date
Name
Owned For
Owner Type
Purchase Details
Closed on
Jul 9, 1999
Sold by
Mohan Jeanie Hoyne
Bought by
Mohan Jeanie Hoyne
Current Estimated Value
Purchase Details
Closed on
Nov 2, 1998
Sold by
Mohan James
Bought by
Mohan Jeanie Hoyne
Purchase Details
Closed on
Feb 27, 1998
Sold by
Shade Terry L
Bought by
Shade Terry Lee
Home Financials for this Owner
Home Financials are based on the most recent Mortgage that was taken out on this home.
Original Mortgage
$325,000
Interest Rate
6.99%
Purchase Details
Closed on
May 9, 1997
Sold by
Shade Terry L
Bought by
Shade Terry Lee
Home Financials for this Owner
Home Financials are based on the most recent Mortgage that was taken out on this home.
Original Mortgage
$326,250
Interest Rate
8.15%
Purchase Details
Closed on
Dec 5, 1996
Sold by
Shade Terry L
Bought by
Shade Terry Lee
Home Financials for this Owner
Home Financials are based on the most recent Mortgage that was taken out on this home.
Original Mortgage
$206,000
Interest Rate
7.67%
Purchase Details
Closed on
Mar 27, 1996
Sold by
Shade Terry Lee
Bought by
Shade Terry Lee
Home Financials for this Owner
Home Financials are based on the most recent Mortgage that was taken out on this home.
Original Mortgage
$207,000
Interest Rate
7.34%
Purchase Details
Closed on
Jun 5, 1995
Sold by
Shade Terry L
Bought by
Shade Terry Lee
Home Financials for this Owner
Home Financials are based on the most recent Mortgage that was taken out on this home.
Original Mortgage
$220,000
Interest Rate
8.32%
Purchase Details
Closed on
May 23, 1995
Sold by
Shade Terry L
Bought by
Shade Terry L
Home Financials for this Owner
Home Financials are based on the most recent Mortgage that was taken out on this home.
Original Mortgage
$220,000
Interest Rate
8.32%
Create a Home Valuation Report for This Property
The Home Valuation Report is an in-depth analysis detailing your home's value as well as a comparison with similar homes in the area
Home Values in the Area
Average Home Value in this Area
Purchase History
| Date | Buyer | Sale Price | Title Company |
|---|---|---|---|
| Mohan Jeanie Hoyne | -- | -- | |
| Mohan Jeanie Hoyne | -- | First American Title Co | |
| Mohan Jeanie Hoyne | $570,000 | First American Title Co | |
| Shade Terry Lee | -- | California Land Title Co | |
| Shade Terry Lee | -- | California Land Title Co | |
| Shade Terry Lee | -- | California Land Title Co | |
| Shade Terry Lee | -- | California Land Title Co | |
| Shade Terry Lee | -- | California Land Title Co | |
| Shade Terry | -- | California Land Title Co | |
| Shade Terry Lee | -- | California Land Title Co | |
| Shade Terry Lee | -- | California Land Title Co | |
| Shade Terry Lee | -- | -- | |
| Shade Terry L | -- | -- |
Source: Public Records
Mortgage History
| Date | Status | Borrower | Loan Amount |
|---|---|---|---|
| Previous Owner | Shade Terry Lee | $325,000 | |
| Previous Owner | Shade Terry Lee | $326,250 | |
| Previous Owner | Shade Terry | $206,000 | |
| Previous Owner | Shade Terry Lee | $207,000 | |
| Previous Owner | Shade Terry L | $220,000 |
Source: Public Records
Tax History Compared to Growth
Tax History
| Year | Tax Paid | Tax Assessment Tax Assessment Total Assessment is a certain percentage of the fair market value that is determined by local assessors to be the total taxable value of land and additions on the property. | Land | Improvement |
|---|---|---|---|---|
| 2024 | $12,032 | $874,791 | $514,516 | $360,275 |
| 2023 | $11,946 | $857,641 | $504,429 | $353,212 |
| 2022 | $11,821 | $840,827 | $494,540 | $346,287 |
| 2021 | $11,598 | $824,343 | $484,845 | $339,498 |
| 2020 | $11,477 | $815,890 | $479,873 | $336,017 |
| 2019 | $11,022 | $799,896 | $470,466 | $329,430 |
| 2018 | $10,868 | $784,215 | $461,243 | $322,972 |
| 2017 | $10,654 | $768,840 | $452,200 | $316,640 |
| 2016 | $10,158 | $753,768 | $443,335 | $310,433 |
| 2015 | $10,132 | $742,446 | $436,676 | $305,770 |
| 2014 | $9,740 | $727,903 | $428,123 | $299,780 |
Source: Public Records
Map
Nearby Homes