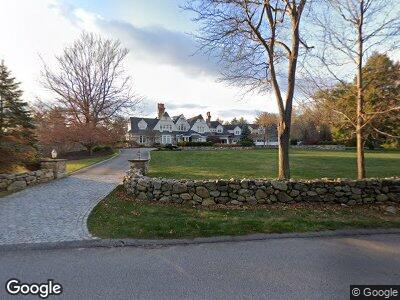
164 Pine St Medfield, MA 02052
Estimated Value: $2,174,000 - $5,036,541
7
Beds
9
Baths
8,470
Sq Ft
$380/Sq Ft
Est. Value
About This Home
This home is located at 164 Pine St, Medfield, MA 02052 and is currently estimated at $3,214,847, approximately $379 per square foot. 164 Pine St is a home located in Norfolk County with nearby schools including Memorial School, Dale Street School, and Ralph Wheelock School.
Ownership History
Date
Name
Owned For
Owner Type
Purchase Details
Closed on
Mar 8, 2017
Sold by
164 Pine Street Rt and Verderber
Bought by
Brookside Vlg Walpole
Current Estimated Value
Home Financials for this Owner
Home Financials are based on the most recent Mortgage that was taken out on this home.
Original Mortgage
$1,000,000
Outstanding Balance
$839,547
Interest Rate
4.19%
Mortgage Type
Credit Line Revolving
Estimated Equity
$2,375,300
Purchase Details
Closed on
Jul 30, 2004
Sold by
Wilson Eleanor C and Wilson Robert L
Bought by
Verderber Jodi G and Verderber Joseph E
Home Financials for this Owner
Home Financials are based on the most recent Mortgage that was taken out on this home.
Original Mortgage
$39,200
Interest Rate
6.33%
Purchase Details
Closed on
Jan 11, 2002
Sold by
Overfield Rt
Bought by
Pine Street Rt
Purchase Details
Closed on
Aug 17, 1998
Sold by
Casey Marybeth D
Bought by
Overfield Rt
Purchase Details
Closed on
Feb 17, 1988
Sold by
Young Robert H
Bought by
Casey Richard G
Create a Home Valuation Report for This Property
The Home Valuation Report is an in-depth analysis detailing your home's value as well as a comparison with similar homes in the area
Home Values in the Area
Average Home Value in this Area
Purchase History
| Date | Buyer | Sale Price | Title Company |
|---|---|---|---|
| Pine Street Rt | $1,125,000 | -- | |
| Overfield Rt | $900,000 | -- | |
| Casey Richard G | $775,000 | -- | |
| Brookside Vlg Walpole | $600,000 | -- | |
| Verderber Jodi G | $426,500 | -- |
Source: Public Records
Mortgage History
| Date | Status | Borrower | Loan Amount |
|---|---|---|---|
| Open | Casey Richard G | $1,000,000 | |
| Previous Owner | 164 Pine Street Rt | $1,000,000 | |
| Previous Owner | 164 Pine Street Rt | $1,100,000 | |
| Previous Owner | Verderber Jodi G | $39,200 | |
| Previous Owner | Casey Richard G | $340,800 |
Source: Public Records
Tax History Compared to Growth
Tax History
| Year | Tax Paid | Tax Assessment Tax Assessment Total Assessment is a certain percentage of the fair market value that is determined by local assessors to be the total taxable value of land and additions on the property. | Land | Improvement |
|---|---|---|---|---|
| 2025 | $67,125 | $4,864,100 | $1,400,500 | $3,463,600 |
| 2024 | $64,551 | $4,409,200 | $1,213,100 | $3,196,100 |
| 2023 | $63,854 | $4,138,300 | $1,169,100 | $2,969,200 |
| 2022 | $66,334 | $3,807,900 | $1,125,100 | $2,682,800 |
| 2021 | $67,641 | $3,808,600 | $1,103,100 | $2,705,500 |
| 2020 | $67,907 | $3,808,600 | $1,103,100 | $2,705,500 |
| 2019 | $67,615 | $3,783,700 | $1,089,900 | $2,693,800 |
| 2018 | $63,311 | $3,717,600 | $1,081,100 | $2,636,500 |
| 2017 | $62,858 | $3,721,600 | $1,085,100 | $2,636,500 |
| 2016 | $63,007 | $3,761,600 | $1,125,100 | $2,636,500 |
| 2015 | $61,233 | $3,817,500 | $948,400 | $2,869,100 |
| 2014 | $60,658 | $3,762,900 | $893,800 | $2,869,100 |
Source: Public Records
Map
Nearby Homes