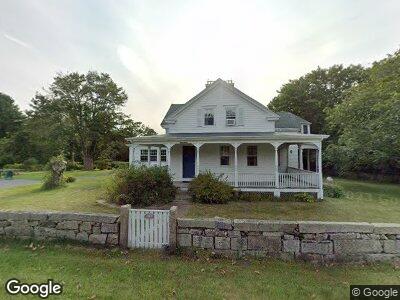
1667 Main Rd Unit 1 Westport, MA 02790
Westport Point NeighborhoodEstimated Value: $631,000 - $882,000
3
Beds
2
Baths
2,667
Sq Ft
$284/Sq Ft
Est. Value
About This Home
This home is located at 1667 Main Rd Unit 1, Westport, MA 02790 and is currently estimated at $757,047, approximately $283 per square foot. 1667 Main Rd Unit 1 is a home located in Bristol County with nearby schools including Alice A. Macomber Primary School and Westport Elementary School.
Ownership History
Date
Name
Owned For
Owner Type
Purchase Details
Closed on
Feb 4, 2015
Sold by
Novotny Douglas and Novotny Catherine M
Bought by
Tolman Timothy R and Torrance Martha E
Current Estimated Value
Purchase Details
Closed on
Oct 30, 2007
Sold by
Morrison Catherine H
Bought by
Novotny Catherine M and Novotny Douglas
Purchase Details
Closed on
Aug 3, 2006
Sold by
Morrison 3Rd Catherine H and Novotny Catherine M
Bought by
Morrison Catherine H
Purchase Details
Closed on
Mar 20, 1998
Sold by
Taber Ruth C
Bought by
Morrison Catherine H
Home Financials for this Owner
Home Financials are based on the most recent Mortgage that was taken out on this home.
Original Mortgage
$300,000
Interest Rate
6.92%
Mortgage Type
Purchase Money Mortgage
Purchase Details
Closed on
Feb 20, 1998
Sold by
Taber Ruth C
Bought by
Knapp Ronald A
Home Financials for this Owner
Home Financials are based on the most recent Mortgage that was taken out on this home.
Original Mortgage
$300,000
Interest Rate
6.92%
Mortgage Type
Purchase Money Mortgage
Create a Home Valuation Report for This Property
The Home Valuation Report is an in-depth analysis detailing your home's value as well as a comparison with similar homes in the area
Home Values in the Area
Average Home Value in this Area
Purchase History
| Date | Buyer | Sale Price | Title Company |
|---|---|---|---|
| Tolman Timothy R | $368,300 | -- | |
| Novotny Catherine M | $41,587 | -- | |
| Morrison Catherine H | -- | -- | |
| Morrison 3Rd Catherine H | -- | -- | |
| Morrison Catherine H | $150,000 | -- | |
| Morrison Exchange T | $225,000 | -- | |
| Knapp Ronald A | $425,000 | -- |
Source: Public Records
Mortgage History
| Date | Status | Borrower | Loan Amount |
|---|---|---|---|
| Previous Owner | Knapp Ronald A | $300,000 |
Source: Public Records
Tax History Compared to Growth
Tax History
| Year | Tax Paid | Tax Assessment Tax Assessment Total Assessment is a certain percentage of the fair market value that is determined by local assessors to be the total taxable value of land and additions on the property. | Land | Improvement |
|---|---|---|---|---|
| 2025 | $3,705 | $497,300 | $0 | $497,300 |
| 2024 | $3,799 | $491,500 | $0 | $491,500 |
| 2023 | $3,742 | $458,600 | $0 | $458,600 |
| 2022 | $3,629 | $427,900 | $0 | $427,900 |
| 2021 | $3,161 | $366,700 | $0 | $366,700 |
| 2020 | $3,091 | $366,700 | $0 | $366,700 |
| 2019 | $3,235 | $391,200 | $0 | $391,200 |
| 2018 | $3,007 | $368,100 | $0 | $368,100 |
| 2017 | $2,650 | $332,500 | $0 | $332,500 |
| 2016 | $2,282 | $288,500 | $0 | $288,500 |
| 2015 | $2,395 | $302,000 | $0 | $302,000 |
Source: Public Records
Map
Nearby Homes
- 1749 Main Rd
- 1541 Main Rd
- 1484 Drift Rd
- 1371 Drift Rd
- 144 Cherry and Webb Ln
- 127D Pettey Ln
- 127 Pettey Ln
- 1161 Drift Rd
- 453 Old Harbor Rd
- 461 Old Harbor Rd
- 161 Old Harbor Rd
- 103 Howland Rd
- 38 Quail Trail
- 64 Old Harbor Rd
- 28 Whistler Point Rd
- 920 Drift Rd
- 0 Adamsville Rd
- 101 Adamsville Rd
- 932 Drift Rd
- 189 Brayton Point Rd