1670 Rainbow Dr NE Lancaster, OH 43130
Estimated Value: $264,000 - $275,250
3
Beds
2
Baths
1,600
Sq Ft
$169/Sq Ft
Est. Value
About This Home
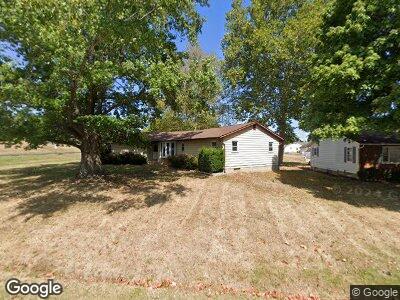
This home is located at 1670 Rainbow Dr NE, Lancaster, OH 43130 and is currently estimated at $270,313, approximately $168 per square foot. 1670 Rainbow Dr NE is a home located in Fairfield County with nearby schools including Medill Elementary School, Thomas Ewing Junior High School, and Lancaster High School.
Ownership History
Date
Name
Owned For
Owner Type
Purchase Details
Closed on
Dec 17, 2024
Sold by
Jel Legacy Investments Llc
Bought by
Raymond Jason D
Current Estimated Value
Purchase Details
Closed on
Jul 29, 2024
Sold by
English Karen F and Strawn Melissa A
Bought by
Jel Legacy Investments Llc
Home Financials for this Owner
Home Financials are based on the most recent Mortgage that was taken out on this home.
Original Mortgage
$23,500
Interest Rate
6.78%
Mortgage Type
Construction
Purchase Details
Closed on
Sep 8, 2021
Sold by
Estate Of Mary K English
Bought by
English Karen F and Strawn Melissa A
Purchase Details
Closed on
Sep 1, 1989
Bought by
English Edward J
Create a Home Valuation Report for This Property
The Home Valuation Report is an in-depth analysis detailing your home's value as well as a comparison with similar homes in the area
Home Values in the Area
Average Home Value in this Area
Purchase History
| Date | Buyer | Sale Price | Title Company |
|---|---|---|---|
| Raymond Jason D | $268,000 | None Listed On Document | |
| Raymond Jason D | $268,000 | None Listed On Document | |
| Jel Legacy Investments Llc | $185,000 | None Listed On Document | |
| English Karen F | -- | None Available | |
| English Edward J | $77,900 | -- |
Source: Public Records
Mortgage History
| Date | Status | Borrower | Loan Amount |
|---|---|---|---|
| Previous Owner | Jel Legacy Investments Llc | $23,500 | |
| Previous Owner | Jel Legacy Investments Llc | $199,500 |
Source: Public Records
Tax History Compared to Growth
Tax History
| Year | Tax Paid | Tax Assessment Tax Assessment Total Assessment is a certain percentage of the fair market value that is determined by local assessors to be the total taxable value of land and additions on the property. | Land | Improvement |
|---|---|---|---|---|
| 2024 | $5,161 | $57,410 | $14,890 | $42,520 |
| 2023 | $2,133 | $57,410 | $14,890 | $42,520 |
| 2022 | $2,146 | $57,410 | $14,890 | $42,520 |
| 2021 | $1,803 | $46,260 | $12,980 | $33,280 |
| 2020 | $1,401 | $46,260 | $12,980 | $33,280 |
| 2019 | $1,332 | $46,260 | $12,980 | $33,280 |
| 2018 | $1,138 | $41,840 | $12,980 | $28,860 |
| 2017 | $1,139 | $39,200 | $10,880 | $28,320 |
| 2016 | $1,109 | $39,200 | $10,880 | $28,320 |
| 2015 | $1,095 | $37,930 | $10,880 | $27,050 |
| 2014 | $1,043 | $37,930 | $10,880 | $27,050 |
| 2013 | $1,043 | $37,930 | $10,880 | $27,050 |
Source: Public Records
Map
Nearby Homes
- 2281 Hawk St
- 1605 Lexington Dr
- 0 Old Millersport Rd NE Unit 225010386
- 2283 Carper St
- 0 Declaration Dr W Unit 219044159
- 1354 Hemlock Ct NE
- 2285 Scenic Dr NE
- 2106 Pleasantville Rd
- 1101 Beechwood Dr NE
- 0 Sheridan Dr Unit 224024834
- 2010 Ridgebrook Rd
- 1425 Meadow Ridge Dr
- 1725 Pleasantview Dr
- 0 Rainbow Dr NE Unit 224021469
- 1072 Sheridan Dr
- 345 Timberlane Heights NE
- 494 Sells Rd
- 416 Crestview Dr NE
- 1294 E Fair Ave
- 1161 Sycamore Dr