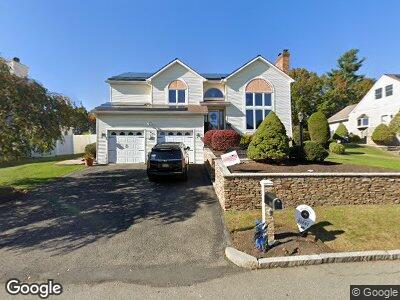
17 Constitution Rd Stoneham, MA 02180
Lindenwood NeighborhoodEstimated Value: $945,343 - $1,137,000
4
Beds
3
Baths
2,256
Sq Ft
$471/Sq Ft
Est. Value
About This Home
This home is located at 17 Constitution Rd, Stoneham, MA 02180 and is currently estimated at $1,062,336, approximately $470 per square foot. 17 Constitution Rd is a home located in Middlesex County with nearby schools including Stoneham High School, St. Patrick Elementary School, and St Joseph School.
Ownership History
Date
Name
Owned For
Owner Type
Purchase Details
Closed on
Sep 20, 2002
Sold by
Guarino John and Guarino Lisa M
Bought by
Deltrecco Adelia
Current Estimated Value
Home Financials for this Owner
Home Financials are based on the most recent Mortgage that was taken out on this home.
Original Mortgage
$419,250
Outstanding Balance
$186,535
Interest Rate
6.36%
Mortgage Type
Purchase Money Mortgage
Estimated Equity
$875,801
Create a Home Valuation Report for This Property
The Home Valuation Report is an in-depth analysis detailing your home's value as well as a comparison with similar homes in the area
Home Values in the Area
Average Home Value in this Area
Purchase History
| Date | Buyer | Sale Price | Title Company |
|---|---|---|---|
| Deltrecco Adelia | $559,000 | -- |
Source: Public Records
Mortgage History
| Date | Status | Borrower | Loan Amount |
|---|---|---|---|
| Open | Guarino John | $35,000 | |
| Closed | Delteco Adelia | $20,000 | |
| Closed | Guarino John | $146,500 | |
| Closed | Deltrecco Adelia | $160,000 | |
| Open | Deltrecco Adelia | $419,250 | |
| Previous Owner | Guarino John | $258,100 | |
| Previous Owner | Guarino John | $58,500 |
Source: Public Records
Tax History Compared to Growth
Tax History
| Year | Tax Paid | Tax Assessment Tax Assessment Total Assessment is a certain percentage of the fair market value that is determined by local assessors to be the total taxable value of land and additions on the property. | Land | Improvement |
|---|---|---|---|---|
| 2025 | $8,960 | $875,900 | $402,100 | $473,800 |
| 2024 | $8,641 | $816,000 | $372,100 | $443,900 |
| 2023 | $8,619 | $776,500 | $342,100 | $434,400 |
| 2022 | $7,603 | $730,400 | $322,100 | $408,300 |
| 2021 | $9,688 | $698,700 | $302,100 | $396,600 |
| 2020 | $7,558 | $700,500 | $302,100 | $398,400 |
| 2019 | $7,437 | $662,800 | $272,100 | $390,700 |
| 2018 | $7,455 | $636,600 | $262,100 | $374,500 |
| 2017 | $7,020 | $566,600 | $232,100 | $334,500 |
| 2016 | $6,781 | $533,900 | $232,100 | $301,800 |
| 2015 | $6,795 | $524,300 | $232,100 | $292,200 |
| 2014 | $6,834 | $506,600 | $222,100 | $284,500 |
Source: Public Records
Map
Nearby Homes
- 57 Augustus Ct Unit 2003
- 75 Augustus Ct Unit 1011
- 75 Augustus Ct Unit 1010
- 53 Forest St
- 9 Abigail Way Unit 3002
- 9 Greenwood Rd
- 19 Dewitt Rd
- 5 Oregon Ave Unit 5
- 12 Girard Rd
- 509 William St
- 295 Salem St Unit 48
- 71 Red Gate Ln
- 40 Main St Unit 505
- 68 Main St Unit 16C
- 2 Leaning Elm Dr
- 64 Main St Unit 37B
- 100 Main St Unit 11
- 1 Albert Dr Unit 2
- 4 Albert Dr Unit 5
- 75 Oak St