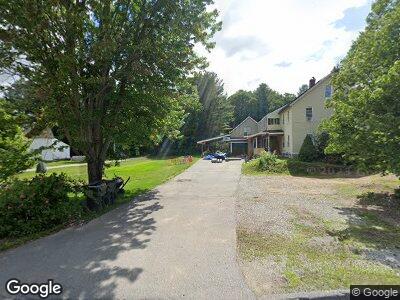
17 Leicester St North Oxford, MA 01537
Estimated Value: $530,538 - $644,000
3
Beds
2
Baths
1,811
Sq Ft
$320/Sq Ft
Est. Value
About This Home
This home is located at 17 Leicester St, North Oxford, MA 01537 and is currently estimated at $580,385, approximately $320 per square foot. 17 Leicester St is a home located in Worcester County with nearby schools including Alfred M Chaffee, Clara Barton Elementary School, and Oxford Middle School.
Ownership History
Date
Name
Owned For
Owner Type
Purchase Details
Closed on
May 16, 2002
Sold by
Laramee Joseph L and Laramee Theresa M
Bought by
Leramee David E and Laramee Rebecca R
Current Estimated Value
Home Financials for this Owner
Home Financials are based on the most recent Mortgage that was taken out on this home.
Original Mortgage
$94,335
Interest Rate
7.15%
Mortgage Type
Purchase Money Mortgage
Create a Home Valuation Report for This Property
The Home Valuation Report is an in-depth analysis detailing your home's value as well as a comparison with similar homes in the area
Home Values in the Area
Average Home Value in this Area
Purchase History
| Date | Buyer | Sale Price | Title Company |
|---|---|---|---|
| Leramee David E | $99,300 | -- |
Source: Public Records
Mortgage History
| Date | Status | Borrower | Loan Amount |
|---|---|---|---|
| Open | Laramee David E | $88,000 | |
| Open | Laramee David E | $185,000 | |
| Closed | Leramee David E | $195,000 | |
| Closed | Laramee David E | $65,600 | |
| Closed | Laramee David | $30,000 | |
| Closed | Laramee David E | $141,500 | |
| Closed | Laramee David | $120,000 | |
| Closed | Leramee David E | $105,000 | |
| Closed | Leramee David E | $94,335 |
Source: Public Records
Tax History Compared to Growth
Tax History
| Year | Tax Paid | Tax Assessment Tax Assessment Total Assessment is a certain percentage of the fair market value that is determined by local assessors to be the total taxable value of land and additions on the property. | Land | Improvement |
|---|---|---|---|---|
| 2025 | $65 | $509,300 | $127,700 | $381,600 |
| 2024 | $6,642 | $492,700 | $118,400 | $374,300 |
| 2023 | $6,089 | $446,400 | $105,700 | $340,700 |
| 2022 | $5,884 | $364,100 | $73,000 | $291,100 |
| 2021 | $5,666 | $342,800 | $69,600 | $273,200 |
| 2020 | $5,434 | $326,200 | $69,600 | $256,600 |
| 2019 | $4,881 | $286,600 | $73,100 | $213,500 |
| 2018 | $4,754 | $275,300 | $73,100 | $202,200 |
| 2017 | $4,785 | $284,000 | $73,100 | $210,900 |
| 2016 | $4,808 | $284,000 | $73,100 | $210,900 |
| 2015 | $4,484 | $284,000 | $73,100 | $210,900 |
| 2014 | $4,434 | $295,600 | $73,100 | $222,500 |
Source: Public Records
Map
Nearby Homes
- 4 Pine Hill Rd
- 134 Southbridge Rd
- 707 Main St
- 6 Thayer Pond Dr Unit 11
- 22 Thayer Pond Dr Unit 6
- 23 Thayer Pond Dr Unit 2
- 23 Thayer Pond Dr Unit 4
- 66 Pleasant St Unit 20
- 5 Stuart St
- 60 Plantation Rd
- 47 Plantation Rd
- 0 Athens St
- 198 West St
- 8 Hycrest Rd
- 426 Stafford St
- 7 Hycrest Rd
- 14 Warren Rd
- 105 Hammond Hill Rd
- 10 Newton Ave
- 11 Waterman Rd