170 Brock Dr Stanford, KY 40484
Estimated Value: $132,947 - $186,000
3
Beds
1
Bath
1,160
Sq Ft
$143/Sq Ft
Est. Value
About This Home
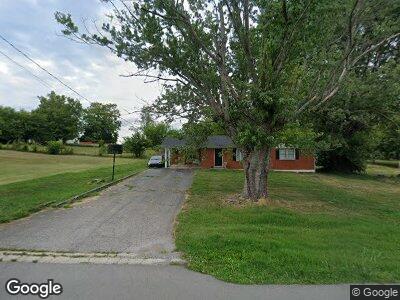
This home is located at 170 Brock Dr, Stanford, KY 40484 and is currently estimated at $165,737, approximately $142 per square foot. 170 Brock Dr is a home located in Lincoln County with nearby schools including Lincoln County High School and Redemption Road Christian Academy.
Ownership History
Date
Name
Owned For
Owner Type
Purchase Details
Closed on
Jun 11, 2021
Sold by
Miniard Billy and Miniard Tara
Bought by
Mcmullen Jessica L
Current Estimated Value
Home Financials for this Owner
Home Financials are based on the most recent Mortgage that was taken out on this home.
Original Mortgage
$111,111
Outstanding Balance
$102,118
Interest Rate
2.9%
Mortgage Type
USDA
Estimated Equity
$65,258
Purchase Details
Closed on
Mar 29, 2019
Sold by
Sears Todd and Sears Tammy
Bought by
Miniard Billy and Miniard Tara
Home Financials for this Owner
Home Financials are based on the most recent Mortgage that was taken out on this home.
Original Mortgage
$84,343
Interest Rate
4.3%
Mortgage Type
FHA
Purchase Details
Closed on
Jun 17, 2009
Sold by
Coleman Tony R and Coleman Billie Sue
Bought by
May Edward G and Sears Todd
Create a Home Valuation Report for This Property
The Home Valuation Report is an in-depth analysis detailing your home's value as well as a comparison with similar homes in the area
Home Values in the Area
Average Home Value in this Area
Purchase History
| Date | Buyer | Sale Price | Title Company |
|---|---|---|---|
| Mcmullen Jessica L | $110,000 | Bluegrass Land Title Llc | |
| Miniard Billy | $85,900 | None Available | |
| May Edward G | $59,000 | None Available |
Source: Public Records
Mortgage History
| Date | Status | Borrower | Loan Amount |
|---|---|---|---|
| Open | Mcmullen Jessica L | $111,111 | |
| Previous Owner | Miniard Billy | $83,681 | |
| Previous Owner | Miniard Billy | $84,017 | |
| Previous Owner | Miniard Billy | $84,343 | |
| Previous Owner | Coleman Bellie Sue | $34,615 |
Source: Public Records
Tax History Compared to Growth
Tax History
| Year | Tax Paid | Tax Assessment Tax Assessment Total Assessment is a certain percentage of the fair market value that is determined by local assessors to be the total taxable value of land and additions on the property. | Land | Improvement |
|---|---|---|---|---|
| 2024 | $1,105 | $115,000 | $115,000 | $0 |
| 2023 | $1,068 | $110,000 | $110,000 | $0 |
| 2022 | $1,070 | $110,000 | $110,000 | $0 |
| 2021 | $977 | $98,000 | $0 | $0 |
| 2020 | $877 | $85,900 | $0 | $0 |
| 2019 | $609 | $59,000 | $0 | $0 |
| 2018 | $603 | $59,000 | $0 | $0 |
| 2017 | $591 | $59,000 | $0 | $0 |
| 2016 | $591 | $59,000 | $0 | $0 |
| 2015 | $487 | $59,000 | $0 | $0 |
| 2012 | $487 | $59,000 | $7,000 | $52,000 |
Source: Public Records
Map
Nearby Homes
- 340 Somerset St
- 3885 U S 27
- 210 Helm St
- 108 Logan Ave
- 195 Logan Ave
- 706 Lancaster St
- 611 Miller St
- 709 Lancaster St
- 106 Herndon Ave
- 105 Darst St
- 911 E Main St
- 312 Harmon Heights
- 101 Elm St
- 417 Harmon Heights
- 2670 Us Highway 150
- 107 Sherwood Dr
- 100 Withers Ct
- 4465 Us Highway 150
- 000 Foster Ln
- 308 Chickasaw Trail