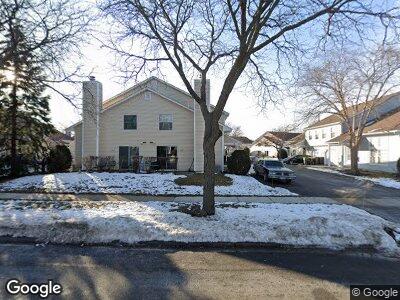
170 Hazelnut Dr Streamwood, IL 60107
Estimated Value: $266,000 - $272,000
3
Beds
2
Baths
1,286
Sq Ft
$209/Sq Ft
Est. Value
About This Home
This home is located at 170 Hazelnut Dr, Streamwood, IL 60107 and is currently estimated at $268,149, approximately $208 per square foot. 170 Hazelnut Dr is a home located in Cook County with nearby schools including Ridge Circle Elementary School, Canton Middle School, and Streamwood High School.
Ownership History
Date
Name
Owned For
Owner Type
Purchase Details
Closed on
Jan 31, 2006
Sold by
Patel Arvind R and Patel Kala A
Bought by
Amin Kishan D and Petel Dahyabhai
Current Estimated Value
Home Financials for this Owner
Home Financials are based on the most recent Mortgage that was taken out on this home.
Original Mortgage
$148,000
Outstanding Balance
$86,154
Interest Rate
6.3%
Mortgage Type
Fannie Mae Freddie Mac
Estimated Equity
$181,995
Purchase Details
Closed on
Jun 23, 1995
Sold by
Rybowiak John F and Rybowiak Kathleen J
Bought by
Patel Arvind R and Patel Kala A
Home Financials for this Owner
Home Financials are based on the most recent Mortgage that was taken out on this home.
Original Mortgage
$91,800
Interest Rate
7.9%
Create a Home Valuation Report for This Property
The Home Valuation Report is an in-depth analysis detailing your home's value as well as a comparison with similar homes in the area
Home Values in the Area
Average Home Value in this Area
Purchase History
| Date | Buyer | Sale Price | Title Company |
|---|---|---|---|
| Amin Kishan D | $185,000 | 1St American Title | |
| Patel Arvind R | $102,000 | -- |
Source: Public Records
Mortgage History
| Date | Status | Borrower | Loan Amount |
|---|---|---|---|
| Open | Amin Kishan D | $21,700 | |
| Closed | Amin Kishan D | $14,000 | |
| Open | Amin Kishan D | $148,000 | |
| Previous Owner | Patel Arvind R | $105,000 | |
| Previous Owner | Patel Arvind R | $32,000 | |
| Previous Owner | Patel Arvind R | $108,000 | |
| Previous Owner | Patel Arvino R | $98,100 | |
| Previous Owner | Patel Arvind R | $91,800 |
Source: Public Records
Tax History Compared to Growth
Tax History
| Year | Tax Paid | Tax Assessment Tax Assessment Total Assessment is a certain percentage of the fair market value that is determined by local assessors to be the total taxable value of land and additions on the property. | Land | Improvement |
|---|---|---|---|---|
| 2024 | $5,400 | $18,000 | $3,500 | $14,500 |
| 2023 | $5,400 | $18,000 | $3,500 | $14,500 |
| 2022 | $5,400 | $18,000 | $3,500 | $14,500 |
| 2021 | $4,913 | $13,440 | $2,541 | $10,899 |
| 2020 | $4,830 | $13,440 | $2,541 | $10,899 |
| 2019 | $4,826 | $15,102 | $2,541 | $12,561 |
| 2018 | $4,809 | $13,654 | $2,215 | $11,439 |
| 2017 | $4,743 | $13,654 | $2,215 | $11,439 |
| 2016 | $4,423 | $13,654 | $2,215 | $11,439 |
| 2015 | $4,460 | $12,573 | $1,955 | $10,618 |
| 2014 | $4,392 | $12,573 | $1,955 | $10,618 |
| 2013 | $4,256 | $12,573 | $1,955 | $10,618 |
Source: Public Records
Map
Nearby Homes
- 276 Acorn Dr
- 189 Hazelnut Dr
- 250 Acorn Dr
- 320 Wisteria Dr
- 2887 Belle Ln Unit 21474836
- 2512 Lawn Ct
- 217 Hackberry Dr
- 2834 Effingham Ct Unit 102P2
- 156 Holmes Way Unit 186221
- 137 Filbert Dr
- 2449 Charleston Dr Unit 5
- 114 Southwood Cir
- 1004 E Streamwood Blvd
- 928 Hartwood Dr
- 58 King Dr
- 1343 Yorkshire Dr
- 32 Ashburn Ct Unit Z1
- 1316 Kingsbury Dr Unit 2
- 220 Sierra Pass Dr Unit 3
- 290 Juniper Cir