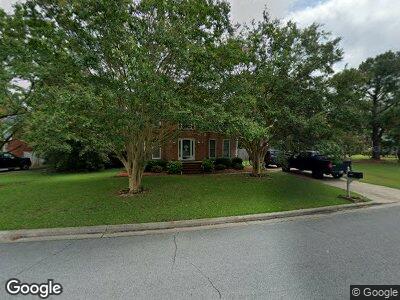
1700 Paramore Dr Greenville, NC 27858
Estimated Value: $290,000 - $301,000
3
Beds
3
Baths
2,000
Sq Ft
$149/Sq Ft
Est. Value
About This Home
This home is located at 1700 Paramore Dr, Greenville, NC 27858 and is currently estimated at $297,536, approximately $148 per square foot. 1700 Paramore Dr is a home located in Pitt County with nearby schools including Wahl Coates Elementary School, E.B. Aycock Middle School, and Junius H. Rose High School.
Ownership History
Date
Name
Owned For
Owner Type
Purchase Details
Closed on
Nov 29, 2023
Sold by
Swinn Craig Michael and Swinn Sarah B
Bought by
Swinn Craig Michael and Swinn Monica Lynne
Current Estimated Value
Home Financials for this Owner
Home Financials are based on the most recent Mortgage that was taken out on this home.
Original Mortgage
$144,000
Outstanding Balance
$142,481
Interest Rate
7.63%
Mortgage Type
New Conventional
Estimated Equity
$166,146
Purchase Details
Closed on
Aug 18, 2008
Sold by
Federal Home Loan Mortgage Corporation
Bought by
Swinn Craig M and Swinn Sarah B
Home Financials for this Owner
Home Financials are based on the most recent Mortgage that was taken out on this home.
Original Mortgage
$161,500
Interest Rate
6.61%
Mortgage Type
Purchase Money Mortgage
Purchase Details
Closed on
Apr 22, 2008
Sold by
Britt Robert E and Britt Frances B
Bought by
Federal Home Loan Mortgage Corporation
Create a Home Valuation Report for This Property
The Home Valuation Report is an in-depth analysis detailing your home's value as well as a comparison with similar homes in the area
Home Values in the Area
Average Home Value in this Area
Purchase History
| Date | Buyer | Sale Price | Title Company |
|---|---|---|---|
| Swinn Craig Michael | $180,000 | None Listed On Document | |
| Swinn Craig M | -- | None Available | |
| Federal Home Loan Mortgage Corporation | $182,921 | None Available |
Source: Public Records
Mortgage History
| Date | Status | Borrower | Loan Amount |
|---|---|---|---|
| Open | Swinn Craig Michael | $144,000 | |
| Previous Owner | Swinn Craig M | $161,500 |
Source: Public Records
Tax History Compared to Growth
Tax History
| Year | Tax Paid | Tax Assessment Tax Assessment Total Assessment is a certain percentage of the fair market value that is determined by local assessors to be the total taxable value of land and additions on the property. | Land | Improvement |
|---|---|---|---|---|
| 2024 | $2,832 | $280,771 | $40,000 | $240,771 |
| 2023 | $2,351 | $192,296 | $37,500 | $154,796 |
| 2022 | $2,377 | $192,296 | $37,500 | $154,796 |
| 2021 | $2,351 | $192,296 | $37,500 | $154,796 |
| 2020 | $2,370 | $192,296 | $37,500 | $154,796 |
| 2019 | $2,418 | $187,396 | $37,500 | $149,896 |
| 2018 | $2,350 | $187,396 | $37,500 | $149,896 |
| 2017 | $2,318 | $184,774 | $37,500 | $147,274 |
| 2016 | $2,271 | $184,774 | $37,500 | $147,274 |
| 2015 | $2,271 | $183,353 | $40,000 | $143,353 |
| 2014 | $2,271 | $183,353 | $40,000 | $143,353 |
Source: Public Records
Map
Nearby Homes
- 2404 King Richard Ct Unit E
- 1515 Paramore Dr
- 25 Scott St
- 1893 Wellons Dr
- 2227 Locksley Woods Dr Unit C
- 2235 Locksley Woods Dr Unit C
- 2235 Locksley Woods Dr Unit E
- 1908 Tiffany Dr
- 102 Loblolly Cir
- 2043 Quail Ridge Rd Unit E
- 106 Hardee Rd
- 2005 Quail Ridge Rd Unit E
- 1303 Fantasia St
- 116 Osceola Dr
- 115 Osceola Dr
- 3904 Cantata Dr
- 3802 Cantata Dr
- 3717 Cantata Dr
- 202 Prince Rd
- 101 David Dr Unit B6