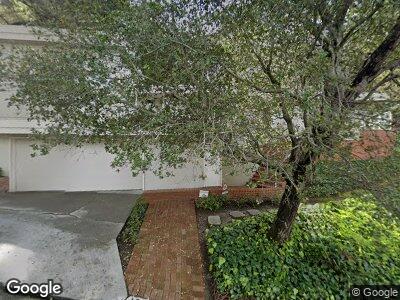
1701 Carter St Oakland, CA 94602
Oakmore NeighborhoodEstimated Value: $1,375,000 - $1,764,154
2
Beds
2
Baths
1,898
Sq Ft
$805/Sq Ft
Est. Value
About This Home
This home is located at 1701 Carter St, Oakland, CA 94602 and is currently estimated at $1,528,789, approximately $805 per square foot. 1701 Carter St is a home located in Alameda County with nearby schools including Joaquin Miller Elementary School, Montera Middle School, and Skyline High School.
Ownership History
Date
Name
Owned For
Owner Type
Purchase Details
Closed on
Apr 4, 2013
Sold by
Ickes Janet A and The Janet A Ickes Living Trust
Bought by
Einspruch Robert and Einspruch Catherine
Current Estimated Value
Home Financials for this Owner
Home Financials are based on the most recent Mortgage that was taken out on this home.
Original Mortgage
$625,500
Interest Rate
3.47%
Mortgage Type
New Conventional
Purchase Details
Closed on
May 8, 2002
Sold by
Smith Jeffrey T and Muir Reinhardt F
Bought by
Ickes Janet A and The Janet A Ickes Living Trust
Purchase Details
Closed on
Sep 15, 1999
Sold by
Brophy Stephen L and C Byrne Margaret S
Bought by
Smith Jeffrey T and Muir Reinhardt F
Home Financials for this Owner
Home Financials are based on the most recent Mortgage that was taken out on this home.
Original Mortgage
$340,000
Interest Rate
7.12%
Create a Home Valuation Report for This Property
The Home Valuation Report is an in-depth analysis detailing your home's value as well as a comparison with similar homes in the area
Home Values in the Area
Average Home Value in this Area
Purchase History
| Date | Buyer | Sale Price | Title Company |
|---|---|---|---|
| Einspruch Robert | $915,000 | Old Republic Title Company | |
| Ickes Janet A | $850,000 | Placer Title Company | |
| Smith Jeffrey T | $490,000 | Northwestern Title Company |
Source: Public Records
Mortgage History
| Date | Status | Borrower | Loan Amount |
|---|---|---|---|
| Open | Einspruch Robert | $537,000 | |
| Closed | Einspruch Robert S | $100,000 | |
| Closed | Einspruch Robert | $625,500 | |
| Previous Owner | Smith Jeffrey T | $340,000 |
Source: Public Records
Tax History Compared to Growth
Tax History
| Year | Tax Paid | Tax Assessment Tax Assessment Total Assessment is a certain percentage of the fair market value that is determined by local assessors to be the total taxable value of land and additions on the property. | Land | Improvement |
|---|---|---|---|---|
| 2024 | $17,835 | $1,237,703 | $331,387 | $913,316 |
| 2023 | $18,805 | $1,220,299 | $324,889 | $895,410 |
| 2022 | $18,377 | $1,189,378 | $318,521 | $877,857 |
| 2021 | $17,755 | $1,165,922 | $312,276 | $860,646 |
| 2020 | $17,556 | $1,160,901 | $309,076 | $851,825 |
| 2019 | $17,011 | $1,138,145 | $303,017 | $835,128 |
| 2018 | $16,641 | $1,115,834 | $297,077 | $818,757 |
| 2017 | $16,046 | $1,093,955 | $291,252 | $802,703 |
| 2016 | $15,624 | $1,072,510 | $285,543 | $786,967 |
| 2015 | $13,915 | $937,517 | $281,255 | $656,262 |
| 2014 | $13,968 | $919,153 | $275,746 | $643,407 |
Source: Public Records
Map
Nearby Homes
- 2025 Braemar Rd
- 389 Somerset Rd
- 2079 Braemar Rd
- 1963 Oakview Dr
- 1975 Wrenn St
- 343 Somerset Rd
- 2093 Braemar Rd
- 4490 Arcadia Ave
- 331 Saint James Dr
- 1887 Trestle Glen Rd
- 2729 Monterey Blvd
- 24 Somerset Rd
- 0 Scout Rd Unit 324085394
- 0 Scout Rd Unit 41056305
- 4715 Edgewood Ave
- 2698 Mountain Gate Way
- 4689 Benevides Ave
- 4660 Dolores Ave
- 4633 Edgewood Ave
- 4224 Lincoln Ave