
Seller's Agent in 2024
Lurline Johnson
Property Profiles, Inc.
(808) 741-1180
2 in this area
24 Total Sales
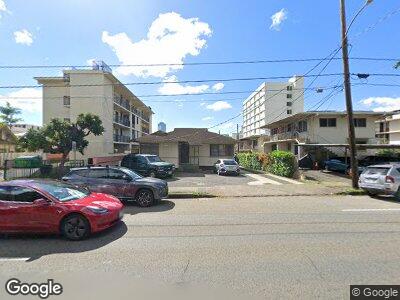
Location! Location! Location! Situated right across from Central Union Church on Beretania Street, between McCully and Punahou Streets, this studio unit offers a prime location. It's close to downtown, Waikiki, Ala Moana, and the University of Hawaii. The building, which houses six units, is older but charming. This particular studio is located on the second floor, behind the main house at the front of the property. Renovated, the studio boasts newer paint, flooring, countertops, kitchen cabinets, lighting, and more. While there's no laundry facility on-site, a laundromat is conveniently located just down the road. Parking is street-only. The rent includes water, hot water, sewer, and trash services; however, the tenant is responsible for electricity and gas for the stove. Additionally, renters insurance is required before moving in. For an appointment, call Lurline at 808-487-9500 x 203 or email Lur@pro808.com.
| Date | Buyer | Sale Price | Title Company |
|---|---|---|---|
| Leong Gilbert K K | -- | None Available | |
| Leong Gilbert K K | -- | None Available | |
| Leong Gilbert K K | -- | None Available | |
| Leong Wesley K H | -- | None Available | |
| Leong Gilbert K K | -- | None Available | |
| Leong Gilbert K K | -- | None Available |
| Date | Event | Price | Change | Sq Ft Price |
|---|---|---|---|---|
| 08/14/2024 08/14/24 | Rented | $1,300 | 0.0% | -- |
| 07/18/2024 07/18/24 | For Rent | $1,300 | +8.3% | -- |
| 03/23/2023 03/23/23 | Off Market | $1,200 | -- | -- |
| 03/21/2023 03/21/23 | Rented | $1,200 | 0.0% | -- |
| 03/04/2023 03/04/23 | For Rent | $1,200 | -- | -- |
| Year | Tax Paid | Tax Assessment Tax Assessment Total Assessment is a certain percentage of the fair market value that is determined by local assessors to be the total taxable value of land and additions on the property. | Land | Improvement |
|---|---|---|---|---|
| 2024 | $6,694 | $1,912,600 | $1,777,200 | $135,400 |
| 2023 | $6,446 | $1,841,600 | $1,712,600 | $129,000 |
| 2022 | $6,084 | $1,738,300 | $1,615,600 | $122,700 |
| 2021 | $5,868 | $1,676,600 | $1,551,000 | $125,600 |
| 2020 | $5,890 | $1,682,800 | $1,551,000 | $131,800 |
| 2019 | $5,078 | $1,584,900 | $1,454,100 | $130,800 |
| 2018 | $5,078 | $1,450,900 | $1,324,800 | $126,100 |
| 2017 | $5,077 | $1,450,700 | $1,292,500 | $158,200 |
| 2016 | $5,029 | $1,436,900 | $1,195,600 | $241,300 |
| 2015 | $5,555 | $1,587,000 | $1,357,100 | $229,900 |
| 2014 | -- | $1,601,700 | $1,376,100 | $225,600 |
Seller's Agent in 2024
Lurline Johnson
Property Profiles, Inc.
(808) 741-1180
2 in this area
24 Total Sales