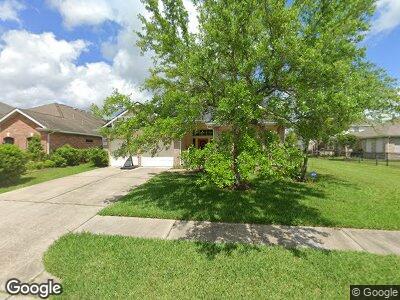
1711 Roaring Springs Ln Seabrook, TX 77586
Taylor Lake Village NeighborhoodEstimated Value: $375,000 - $401,000
4
Beds
4
Baths
2,873
Sq Ft
$135/Sq Ft
Est. Value
About This Home
This home is located at 1711 Roaring Springs Ln, Seabrook, TX 77586 and is currently estimated at $388,004, approximately $135 per square foot. 1711 Roaring Springs Ln is a home located in Harris County with nearby schools including G.W. Robinson Elementary, Seabrook Intermediate School, and Clear Lake High School.
Ownership History
Date
Name
Owned For
Owner Type
Purchase Details
Closed on
Mar 15, 2024
Sold by
Mayne Stephen Hughes
Bought by
Zidek-Mayne Susan Marie
Current Estimated Value
Home Financials for this Owner
Home Financials are based on the most recent Mortgage that was taken out on this home.
Original Mortgage
$233,225
Outstanding Balance
$231,443
Interest Rate
6.94%
Mortgage Type
Seller Take Back
Estimated Equity
$157,896
Purchase Details
Closed on
Apr 1, 2016
Sold by
Zidek Rosenblatt Kathryn A
Bought by
Zidek Mayne Susan and Mayne Stephen H
Home Financials for this Owner
Home Financials are based on the most recent Mortgage that was taken out on this home.
Original Mortgage
$233,225
Interest Rate
3.65%
Mortgage Type
New Conventional
Purchase Details
Closed on
Jul 9, 2014
Sold by
Ou Ling Ing and Ingou Ling
Bought by
Zidek Rosenblatt Kathryn A
Purchase Details
Closed on
Jul 31, 2002
Sold by
Brighton Homes Ltd
Bought by
Ingou Ling
Create a Home Valuation Report for This Property
The Home Valuation Report is an in-depth analysis detailing your home's value as well as a comparison with similar homes in the area
Home Values in the Area
Average Home Value in this Area
Purchase History
| Date | Buyer | Sale Price | Title Company |
|---|---|---|---|
| Zidek-Mayne Susan Marie | -- | None Listed On Document | |
| Zidek-Mayne Susan Marie | -- | None Listed On Document | |
| Zidek Mayne Susan | -- | Stewart Title Company | |
| Zidek Rosenblatt Kathryn A | -- | Startex Title Co | |
| Zidek Rosenblatt Kathryn A | -- | Startex Title Co | |
| Ingou Ling | -- | Alamo Title Company |
Source: Public Records
Mortgage History
| Date | Status | Borrower | Loan Amount |
|---|---|---|---|
| Open | Zidek-Mayne Susan Marie | $233,225 | |
| Closed | Zidek-Mayne Susan Marie | $233,225 | |
| Previous Owner | Zidek Mayne Susan | $233,225 |
Source: Public Records
Tax History Compared to Growth
Tax History
| Year | Tax Paid | Tax Assessment Tax Assessment Total Assessment is a certain percentage of the fair market value that is determined by local assessors to be the total taxable value of land and additions on the property. | Land | Improvement |
|---|---|---|---|---|
| 2023 | $7,027 | $382,459 | $105,905 | $276,554 |
| 2022 | $8,690 | $360,941 | $105,905 | $255,036 |
| 2021 | $8,567 | $337,019 | $88,665 | $248,354 |
| 2020 | $8,814 | $318,527 | $81,276 | $237,251 |
| 2019 | $8,599 | $294,421 | $91,818 | $202,603 |
| 2018 | $2,762 | $267,836 | $75,124 | $192,712 |
| 2017 | $7,715 | $267,836 | $75,124 | $192,712 |
| 2016 | $7,345 | $255,000 | $67,890 | $187,110 |
| 2015 | $5,238 | $242,000 | $67,890 | $174,110 |
| 2014 | $5,238 | $220,000 | $67,890 | $152,110 |
Source: Public Records
Map
Nearby Homes
- 1726 Roaring Springs Ln
- 1415 Sunset Bay Ct
- 1410 Sunset Bay Ct
- 1303 Lakeway Dr
- 1907 Ray Shell Ct
- 1818 Ray Shell Ct
- 1314 Bluebonnet Dr
- 1410 Poplar Ct
- 1406 Spring Cress Ln
- 1218 Bluebonnet Dr
- 1410 Juniper Ln
- 1410 Sweet Stone Ct
- 3005 S Island Dr
- 1415 Ivory Crossing Ct
- 4145 Boardwalk Blvd
- 1407 Ivory Crossing Ct
- 0 Red Bluff Unit 47813509
- 1211 Shorewood Dr
- 1215 Shorewood Dr
- 2922 N Island Dr