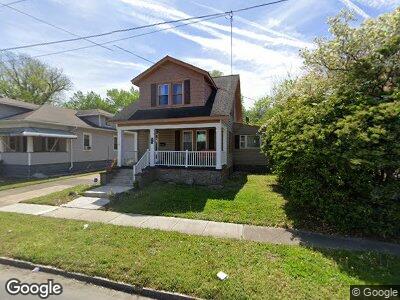
1711 Springfield Ave Norfolk, VA 23523
Campostella NeighborhoodEstimated Value: $265,000 - $305,000
3
Beds
3
Baths
1,692
Sq Ft
$169/Sq Ft
Est. Value
About This Home
This home is located at 1711 Springfield Ave, Norfolk, VA 23523 and is currently estimated at $286,738, approximately $169 per square foot. 1711 Springfield Ave is a home located in Norfolk City with nearby schools including Southside STEM Academy at Campostella, Blair Middle School, and Lake Taylor High School.
Ownership History
Date
Name
Owned For
Owner Type
Purchase Details
Closed on
Jul 21, 2022
Sold by
Karen Rivera
Bought by
Jimenez Thalia Giacynthia
Current Estimated Value
Home Financials for this Owner
Home Financials are based on the most recent Mortgage that was taken out on this home.
Original Mortgage
$301,682
Outstanding Balance
$287,992
Interest Rate
4%
Mortgage Type
VA
Estimated Equity
-$1,254
Purchase Details
Closed on
Jan 22, 2018
Sold by
Lawrence Gregory
Bought by
Koulis Karen and Koulis John
Home Financials for this Owner
Home Financials are based on the most recent Mortgage that was taken out on this home.
Original Mortgage
$209,407
Interest Rate
3.93%
Mortgage Type
VA
Purchase Details
Closed on
Nov 3, 2016
Sold by
Nationstar Mortgage Llc Doing Business I
Bought by
The Springfield Trust
Purchase Details
Closed on
Jun 21, 2016
Sold by
Equity Trustees Llc A Virginia Limited L and Gordon Edward
Bought by
Nationstar Mortgage Llc
Create a Home Valuation Report for This Property
The Home Valuation Report is an in-depth analysis detailing your home's value as well as a comparison with similar homes in the area
Home Values in the Area
Average Home Value in this Area
Purchase History
| Date | Buyer | Sale Price | Title Company |
|---|---|---|---|
| Jimenez Thalia Giacynthia | $294,900 | Navy Federal Title | |
| Koulis Karen | $205,000 | Attorney | |
| The Springfield Trust | $58,000 | Attorney | |
| Nationstar Mortgage Llc | $82,600 | None Available |
Source: Public Records
Mortgage History
| Date | Status | Borrower | Loan Amount |
|---|---|---|---|
| Open | Jimenez Thalia Giacynthia | $301,682 | |
| Previous Owner | Koulis Karen | $209,407 | |
| Previous Owner | Gordon Pearlie M | $213,000 |
Source: Public Records
Tax History Compared to Growth
Tax History
| Year | Tax Paid | Tax Assessment Tax Assessment Total Assessment is a certain percentage of the fair market value that is determined by local assessors to be the total taxable value of land and additions on the property. | Land | Improvement |
|---|---|---|---|---|
| 2024 | $3,374 | $269,900 | $80,300 | $189,600 |
| 2023 | $3,241 | $259,300 | $80,300 | $179,000 |
| 2022 | $2,605 | $208,400 | $55,500 | $152,900 |
| 2021 | $2,420 | $193,600 | $55,500 | $138,100 |
| 2020 | $2,356 | $188,500 | $50,400 | $138,100 |
| 2019 | $2,249 | $179,900 | $50,400 | $129,500 |
| 2018 | $1,729 | $138,300 | $50,400 | $87,900 |
| 2017 | $1,561 | $135,700 | $50,400 | $85,300 |
| 2016 | $1,561 | $129,400 | $48,000 | $81,400 |
| 2015 | -- | $129,400 | $48,000 | $81,400 |
| 2014 | -- | $129,400 | $48,000 | $81,400 |
Source: Public Records
Map
Nearby Homes
- 1721 Canton Ave
- 1812 Montclair Ave
- 1817 Arlington Ave
- 1904 Princeton Ave
- 704 Sycamore St
- 1520 E Indian River Rd
- 1304 Cass St
- 1204 Covel St
- 1212 Hatton St
- 1509 Melon St
- 1602 Wilson Rd
- 1511 Selden Ave
- 1307 Hibie St
- 1620 Conoga St
- 2620 Marlboro Ave
- 1413 Vine St
- 1529 Vine St
- 2708 Kimball Terrace
- 2822 Marlboro Ave
- 715 Filer St