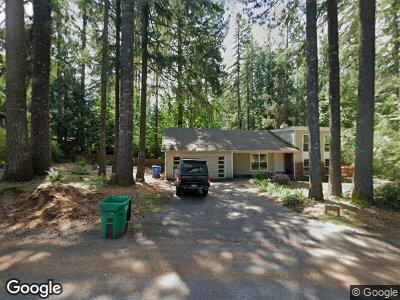
1713 Camden Park Dr SW Olympia, WA 98512
Estimated Value: $603,000 - $745,000
3
Beds
3
Baths
2,400
Sq Ft
$273/Sq Ft
Est. Value
About This Home
This home is located at 1713 Camden Park Dr SW, Olympia, WA 98512 and is currently estimated at $655,307, approximately $273 per square foot. 1713 Camden Park Dr SW is a home located in Thurston County with nearby schools including McLane Elementary School, Thurgood Marshall Middle School, and Capital High School.
Ownership History
Date
Name
Owned For
Owner Type
Purchase Details
Closed on
Jun 23, 2008
Sold by
Denunzio Troy M and Denunzio Stone Maria S
Bought by
Moore Jocelyn Shelley and Wood Kelly Thomas
Current Estimated Value
Home Financials for this Owner
Home Financials are based on the most recent Mortgage that was taken out on this home.
Original Mortgage
$275,000
Interest Rate
5.99%
Mortgage Type
Unknown
Purchase Details
Closed on
Nov 30, 2006
Sold by
Garlington Thomas R and Garlington Dolores
Bought by
Denunzio Troy M and Denunzio Stone Maria S
Home Financials for this Owner
Home Financials are based on the most recent Mortgage that was taken out on this home.
Original Mortgage
$216,000
Interest Rate
6.38%
Mortgage Type
Unknown
Purchase Details
Closed on
Jul 6, 1998
Sold by
Lakemoor Community Club Inc
Bought by
Garlington Thomas R and Dolores Garlington J
Create a Home Valuation Report for This Property
The Home Valuation Report is an in-depth analysis detailing your home's value as well as a comparison with similar homes in the area
Home Values in the Area
Average Home Value in this Area
Purchase History
| Date | Buyer | Sale Price | Title Company |
|---|---|---|---|
| Moore Jocelyn Shelley | $399,000 | First American Title | |
| Denunzio Troy M | $270,000 | Thurston County Title | |
| Garlington Thomas R | -- | First American Title Ins Co |
Source: Public Records
Mortgage History
| Date | Status | Borrower | Loan Amount |
|---|---|---|---|
| Open | Wood Jocelyn Harris | $360,000 | |
| Closed | Wood Jocelyn Harris | $273,000 | |
| Closed | Moore Jocelyn S | $279,000 | |
| Closed | Moore Jocelyn Shelley | $275,000 | |
| Previous Owner | Denunzio Troy M | $216,000 |
Source: Public Records
Tax History Compared to Growth
Tax History
| Year | Tax Paid | Tax Assessment Tax Assessment Total Assessment is a certain percentage of the fair market value that is determined by local assessors to be the total taxable value of land and additions on the property. | Land | Improvement |
|---|---|---|---|---|
| 2024 | $5,215 | $510,400 | $183,100 | $327,300 |
| 2023 | $5,215 | $498,600 | $164,800 | $333,800 |
| 2022 | $5,150 | $510,700 | $130,900 | $379,800 |
| 2021 | $4,450 | $431,000 | $119,500 | $311,500 |
| 2020 | $4,248 | $344,600 | $117,000 | $227,600 |
| 2019 | $3,773 | $320,900 | $86,800 | $234,100 |
| 2018 | $3,768 | $279,700 | $80,200 | $199,500 |
| 2017 | $3,339 | $267,100 | $82,600 | $184,500 |
| 2016 | $2,990 | $246,300 | $78,700 | $167,600 |
| 2014 | -- | $239,000 | $78,700 | $160,300 |
Source: Public Records
Map
Nearby Homes
- 1515 Lakemoor Loop SW
- 3805 Park Dr SW
- 1111 Archwood Dr SW Unit 343
- 1111 Archwood Dr SW Unit 429
- 1111 Archwood Dr SW Unit 442
- 1111 Archwood Dr SW Unit 255
- 1111 Archwood Dr SW Unit 213
- 1111 Archwood Dr SW Unit 334
- 1111 Archwood Dr SW Unit 327
- 1111 Archwood Dr SW Unit 204
- 1111 Archwood Dr SW Unit 345
- 1111 Archwood Dr SW Unit 324
- 1111 Archwood Dr SW Unit 447
- 2200 Black Lake Blvd SW
- 1111 Archwood Dr SW Unit 196
- 1111 Archwood Dr SW Unit 361
- 1111 Archwood Dr SW Unit 395
- 1111 Archwood Dr SW Unit 360
- 4121 Park Dr SW
- 1335 Fern St SW