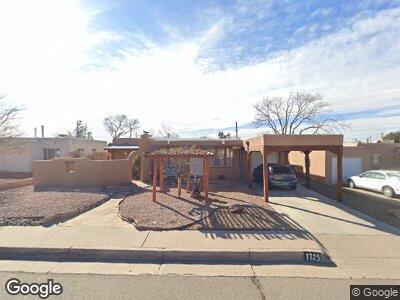
1725 Bryn Mawr Dr NE Albuquerque, NM 87106
Estimated Value: $326,000 - $404,000
2
Beds
1
Bath
1,180
Sq Ft
$306/Sq Ft
Est. Value
About This Home
This home is located at 1725 Bryn Mawr Dr NE, Albuquerque, NM 87106 and is currently estimated at $361,459, approximately $306 per square foot. 1725 Bryn Mawr Dr NE is a home located in Bernalillo County with nearby schools including Montezuma Elementary School, Jefferson Middle School, and Albuquerque High School.
Ownership History
Date
Name
Owned For
Owner Type
Purchase Details
Closed on
Oct 29, 2010
Sold by
Veri Richard E and Veri Sandra A
Bought by
Veri Richard E and Veri Sandra A
Current Estimated Value
Home Financials for this Owner
Home Financials are based on the most recent Mortgage that was taken out on this home.
Original Mortgage
$50,000
Interest Rate
4.41%
Mortgage Type
New Conventional
Purchase Details
Closed on
Feb 26, 2009
Sold by
Veri Richard E and Veri Sandra A
Bought by
Veri Richard E and Veri Sandra A
Purchase Details
Closed on
Jan 28, 2002
Sold by
Sidebottom Lane A and Watkin Lane A
Bought by
Veri Richard E and Veri Sandra A
Home Financials for this Owner
Home Financials are based on the most recent Mortgage that was taken out on this home.
Original Mortgage
$89,600
Interest Rate
7.15%
Mortgage Type
Purchase Money Mortgage
Create a Home Valuation Report for This Property
The Home Valuation Report is an in-depth analysis detailing your home's value as well as a comparison with similar homes in the area
Home Values in the Area
Average Home Value in this Area
Purchase History
| Date | Buyer | Sale Price | Title Company |
|---|---|---|---|
| Veri Richard E | -- | Accommodation | |
| Veri Richard E | -- | Stewart Title | |
| Veri Richard E | -- | None Available | |
| Veri Richard E | -- | First American Title Co | |
| Sidebottom Lane A | -- | First American Title Co |
Source: Public Records
Mortgage History
| Date | Status | Borrower | Loan Amount |
|---|---|---|---|
| Open | Richard | $85,000 | |
| Closed | Veri Richard E | $100,000 | |
| Closed | Veri Richarde E | $61,000 | |
| Previous Owner | Veri Richard E | $50,000 | |
| Previous Owner | Veri Richard E | $89,600 |
Source: Public Records
Tax History Compared to Growth
Tax History
| Year | Tax Paid | Tax Assessment Tax Assessment Total Assessment is a certain percentage of the fair market value that is determined by local assessors to be the total taxable value of land and additions on the property. | Land | Improvement |
|---|---|---|---|---|
| 2024 | $2,679 | $65,502 | $23,618 | $41,884 |
| 2023 | $2,632 | $63,595 | $22,930 | $40,665 |
| 2022 | $2,541 | $61,742 | $22,262 | $39,480 |
| 2021 | $2,453 | $59,944 | $21,614 | $38,330 |
| 2020 | $2,411 | $58,199 | $20,985 | $37,214 |
| 2019 | $1,216 | $56,504 | $20,374 | $36,130 |
| 2018 | $2,337 | $56,504 | $20,374 | $36,130 |
| 2017 | $2,265 | $54,859 | $19,781 | $35,078 |
| 2016 | $2,200 | $51,710 | $18,645 | $33,065 |
| 2015 | $49,021 | $49,021 | $18,103 | $30,918 |
| 2014 | $971 | $47,594 | $17,576 | $30,018 |
| 2013 | -- | $46,207 | $17,064 | $29,143 |
Source: Public Records
Map
Nearby Homes
- 1821 Bryn Mawr Dr NE
- 1934 Bryn Mawr Dr NE
- 1736 Miracerros Place NE
- 1701 Miracerros Place NE
- 1924 Girard Blvd NE
- 3406 Indian School Rd NE Unit B
- 1423 Princeton Dr NE
- 1400 Bryn Mawr Dr NE
- 1323 Richmond Dr NE
- 1324 Stanford Dr NE
- 1224 Vassar Dr NE
- 1320 Stanford Dr NE
- 1237 Princeton Dr NE
- 1826 Morningside Dr NE
- 1527 Aliso Dr NE
- 4116 Coe Dr NE
- 4220 Altura Mesa Ln NE
- 1901 Avenida Alturas NE
- 2725 Hermosa Dr NE
- 1000 Richmond Dr NE