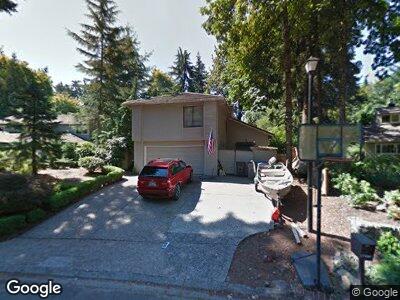
17427 SW Rivendell Dr Portland, OR 97224
Kingsgate NeighborhoodEstimated Value: $728,838 - $765,000
4
Beds
3
Baths
2,565
Sq Ft
$291/Sq Ft
Est. Value
About This Home
This home is located at 17427 SW Rivendell Dr, Portland, OR 97224 and is currently estimated at $746,710, approximately $291 per square foot. 17427 SW Rivendell Dr is a home located in Washington County with nearby schools including Durham Elementary School, Twality Middle School, and Tualatin High School.
Ownership History
Date
Name
Owned For
Owner Type
Purchase Details
Closed on
Sep 2, 2016
Sold by
Shavlovskiy Victoria and Yovko Lyubov
Bought by
Yovko Vladimir
Current Estimated Value
Purchase Details
Closed on
Jul 26, 2005
Sold by
Oathes Robert H and Oathes Marijo R
Bought by
Yovko Lyubov
Home Financials for this Owner
Home Financials are based on the most recent Mortgage that was taken out on this home.
Original Mortgage
$334,000
Outstanding Balance
$186,463
Interest Rate
5.87%
Mortgage Type
Fannie Mae Freddie Mac
Estimated Equity
$578,239
Purchase Details
Closed on
Dec 13, 1999
Sold by
Colleknon Carl R and Colleknon Brenda D
Bought by
Oathes Robert H and Oathes Marijo R
Home Financials for this Owner
Home Financials are based on the most recent Mortgage that was taken out on this home.
Original Mortgage
$204,000
Interest Rate
7.96%
Purchase Details
Closed on
May 25, 1999
Sold by
Colleknon Carl R and Colleknon Sue A
Bought by
Colleknon Carl R and Colleknon Brenda D
Create a Home Valuation Report for This Property
The Home Valuation Report is an in-depth analysis detailing your home's value as well as a comparison with similar homes in the area
Home Values in the Area
Average Home Value in this Area
Purchase History
| Date | Buyer | Sale Price | Title Company |
|---|---|---|---|
| Yovko Vladimir | -- | None Available | |
| Yovko Lyubov | $417,500 | Ticor Title Insurance Compan | |
| Oathes Robert H | $255,000 | Chicago Title | |
| Colleknon Carl R | -- | Fidelity National Title |
Source: Public Records
Mortgage History
| Date | Status | Borrower | Loan Amount |
|---|---|---|---|
| Open | Yovko Lyubov | $334,000 | |
| Previous Owner | Oathes Robert H | $204,000 |
Source: Public Records
Tax History Compared to Growth
Tax History
| Year | Tax Paid | Tax Assessment Tax Assessment Total Assessment is a certain percentage of the fair market value that is determined by local assessors to be the total taxable value of land and additions on the property. | Land | Improvement |
|---|---|---|---|---|
| 2025 | $6,148 | $424,600 | -- | -- |
| 2024 | $5,986 | $412,240 | -- | -- |
| 2023 | $5,986 | $400,240 | $0 | $0 |
| 2022 | $5,814 | $400,240 | $0 | $0 |
| 2021 | $5,670 | $377,280 | $0 | $0 |
| 2020 | $5,503 | $366,300 | $0 | $0 |
| 2019 | $5,352 | $355,640 | $0 | $0 |
| 2018 | $5,337 | $345,290 | $0 | $0 |
| 2017 | $5,320 | $335,240 | $0 | $0 |
| 2016 | $5,057 | $325,480 | $0 | $0 |
| 2015 | $4,830 | $316,000 | $0 | $0 |
| 2014 | $4,761 | $306,800 | $0 | $0 |
Source: Public Records
Map
Nearby Homes
- 8099 SW Woody End St
- 8147 SW Kingfisher Way
- 7671 SW Willowbottom Way
- 17075 SW Arkenstone Dr
- 16503 SW Cambridge Ln
- 16491 SW Cambridge Ln
- 7671 SW Cambridge Ln
- 16353 SW Cambridge Ln
- 7603 SW Taylor Ln
- 7603 SW Taylor Ln
- 7603 SW Taylor Ln
- 7671 SW Taylor Ln
- 7603 SW Taylor Ln
- 7603 SW Taylor Ln
- 16413 SW Cambridge Ln
- 7603 SW Taylor Ln
- 16401 SW Cambridge Ln
- 16504 SW Cambridge Ln
- 16519 SW Cambridge Ln
- 16426 SW Cambridge Ln