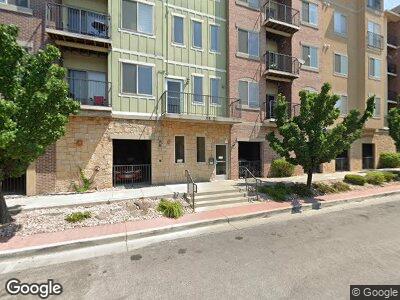
175 Albion Village Way Unit 104 Sandy, UT 84070
White City NeighborhoodEstimated Value: $319,000 - $336,990
2
Beds
2
Baths
1,156
Sq Ft
$285/Sq Ft
Est. Value
About This Home
This home is located at 175 Albion Village Way Unit 104, Sandy, UT 84070 and is currently estimated at $329,248, approximately $284 per square foot. 175 Albion Village Way Unit 104 is a home located in Salt Lake County with nearby schools including Jordan High and Mount Jordan Middle School.
Ownership History
Date
Name
Owned For
Owner Type
Purchase Details
Closed on
Jan 30, 2025
Sold by
Baxter Christine
Bought by
Knight Joshua and Knight Chantele
Current Estimated Value
Home Financials for this Owner
Home Financials are based on the most recent Mortgage that was taken out on this home.
Original Mortgage
$18,970
Outstanding Balance
$18,970
Interest Rate
6.72%
Estimated Equity
$313,396
Purchase Details
Closed on
Oct 15, 2020
Sold by
Buck Gary T
Bought by
Baxter Jon and Baxter Christine
Purchase Details
Closed on
Nov 22, 2004
Sold by
Albion Village Llc
Bought by
Buck Gary T
Home Financials for this Owner
Home Financials are based on the most recent Mortgage that was taken out on this home.
Original Mortgage
$104,400
Interest Rate
7.62%
Mortgage Type
Stand Alone First
Create a Home Valuation Report for This Property
The Home Valuation Report is an in-depth analysis detailing your home's value as well as a comparison with similar homes in the area
Home Values in the Area
Average Home Value in this Area
Purchase History
| Date | Buyer | Sale Price | Title Company |
|---|---|---|---|
| Knight Joshua | -- | Backman Title Services | |
| Knight Joshua | -- | Backman Title Services | |
| Baxter Jon | -- | Old Republic Ttl Draper Orem | |
| Buck Gary T | -- | Equity Title |
Source: Public Records
Mortgage History
| Date | Status | Borrower | Loan Amount |
|---|---|---|---|
| Open | Knight Joshua | $18,970 | |
| Closed | Knight Joshua | $18,970 | |
| Open | Knight Joshua | $316,167 | |
| Closed | Knight Joshua | $316,167 | |
| Previous Owner | Buck Gary T | $131,250 | |
| Previous Owner | Buck Gary T | $104,400 |
Source: Public Records
Tax History Compared to Growth
Tax History
| Year | Tax Paid | Tax Assessment Tax Assessment Total Assessment is a certain percentage of the fair market value that is determined by local assessors to be the total taxable value of land and additions on the property. | Land | Improvement |
|---|---|---|---|---|
| 2023 | $1,864 | $343,800 | $103,100 | $240,700 |
| 2022 | $1,882 | $339,100 | $101,700 | $237,400 |
| 2021 | $1,609 | $246,700 | $74,000 | $172,700 |
| 2020 | $1,497 | $216,500 | $64,900 | $151,600 |
| 2019 | $1,430 | $201,500 | $60,400 | $141,100 |
| 2018 | $1,269 | $180,300 | $54,100 | $126,200 |
| 2017 | $1,199 | $163,000 | $48,900 | $114,100 |
| 2016 | $1,205 | $158,800 | $47,600 | $111,200 |
| 2015 | $1,238 | $151,100 | $45,300 | $105,800 |
| 2014 | $1,250 | $149,600 | $44,900 | $104,700 |
Source: Public Records
Map
Nearby Homes
- 165 Albion Village Way Unit 303
- 170 Albion Village Way Unit 202
- 172 W Alta View Way
- 175 E Millerburg Dr S
- 8405 S 700 E
- 65 E 11000 S
- 9240 S 150 E
- 102 W Alta View Way Unit 7
- 9780 S Alta View Cir
- 8054 S Mill Grove Ln Unit 104
- 555 W 9400 S
- 51 Crawford Place
- 623 W Villa Bluff Dr
- 9436 S 220 E
- 9928 S Cascade Park Dr
- 9662 S Villa Springs Cove
- 494 W 9260 St S
- 282 E 9545 S
- 36 Tiny Wood Dr
- 9505 S Hidden Point Dr