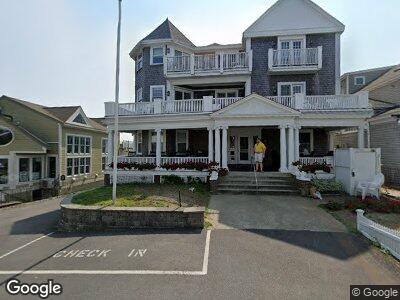
175 Commercial St Provincetown, MA 2657
Provincetown NeighborhoodEstimated Value: $8,315,560
20
Beds
--
Bath
9,655
Sq Ft
$861/Sq Ft
Est. Value
About This Home
This home is located at 175 Commercial St, Provincetown, MA 2657 and is currently estimated at $8,315,560, approximately $861 per square foot. 175 Commercial St is a home located in Barnstable County with nearby schools including Provincetown Schools.
Ownership History
Date
Name
Owned For
Owner Type
Purchase Details
Closed on
May 28, 2010
Sold by
Red Inn Llc
Bought by
175 Beach House Llc
Current Estimated Value
Home Financials for this Owner
Home Financials are based on the most recent Mortgage that was taken out on this home.
Original Mortgage
$1,181,000
Interest Rate
4.98%
Mortgage Type
Commercial
Purchase Details
Closed on
May 19, 2004
Sold by
3471 Inc
Bought by
Red Inn Llc
Home Financials for this Owner
Home Financials are based on the most recent Mortgage that was taken out on this home.
Original Mortgage
$1,500,000
Interest Rate
5.75%
Mortgage Type
Commercial
Purchase Details
Closed on
Jul 17, 2003
Sold by
Peter L Boyle Irt and Walsh Heather M
Bought by
3471 Inc
Create a Home Valuation Report for This Property
The Home Valuation Report is an in-depth analysis detailing your home's value as well as a comparison with similar homes in the area
Home Values in the Area
Average Home Value in this Area
Purchase History
| Date | Buyer | Sale Price | Title Company |
|---|---|---|---|
| 175 Beach House Llc | $3,825,000 | -- | |
| Red Inn Llc | $3,700,000 | -- | |
| 3471 Inc | $3,440,181 | -- |
Source: Public Records
Mortgage History
| Date | Status | Borrower | Loan Amount |
|---|---|---|---|
| Open | 175 Beach House Llc | $1,538,694 | |
| Closed | 175 Beach House Llc | $300,000 | |
| Closed | Home Town Rt | $1,181,000 | |
| Closed | 175 Beach House Llc | $1,950,000 | |
| Closed | Home Town Rt | $1,170,000 | |
| Previous Owner | Red Inn Llc | $1,500,000 | |
| Previous Owner | Home Town Rt | $1,575,000 | |
| Previous Owner | Home Town Rt | $50,000 |
Source: Public Records
Tax History Compared to Growth
Tax History
| Year | Tax Paid | Tax Assessment Tax Assessment Total Assessment is a certain percentage of the fair market value that is determined by local assessors to be the total taxable value of land and additions on the property. | Land | Improvement |
|---|---|---|---|---|
| 2025 | $34,946 | $6,694,600 | $3,424,100 | $3,270,500 |
| 2024 | $33,241 | $6,380,200 | $3,262,900 | $3,117,300 |
| 2023 | $33,114 | $5,809,400 | $2,837,800 | $2,971,600 |
| 2022 | $30,752 | $4,827,700 | $2,656,600 | $2,171,100 |
| 2021 | $31,846 | $4,704,000 | $2,595,000 | $2,109,000 |
| 2020 | $29,303 | $4,636,600 | $2,588,200 | $2,048,400 |
| 2019 | $28,632 | $4,241,800 | $2,512,800 | $1,729,000 |
| 2018 | $29,465 | $4,098,100 | $2,520,800 | $1,577,300 |
| 2017 | $29,830 | $4,004,000 | $2,471,300 | $1,532,700 |
| 2016 | $28,374 | $3,881,500 | $2,399,300 | $1,482,200 |
| 2015 | $27,981 | $3,791,400 | $2,352,000 | $1,439,400 |
Source: Public Records
Map
Nearby Homes
- 176 Commercial St Unit 2
- 165 Commercial St Unit 4
- 4 Carver St
- 11 Central St Unit 1
- 9 Bradford St
- 9 Conant St
- 54 Bradford St Unit 2-3
- 54 Bradford St Unit C
- 83 Bradford St Unit 2
- 140 Commercial St
- 27 Court St Unit PF
- 27 Court St Pf
- 33 Conant St
- 35 Conant St
- 6 Winslow St
- 109 Commercial St
- 36 Shank Painter Rd Unit 11
- 294 Commercial St
- 24 Winslow St
- 3 Race Rd Unit C