

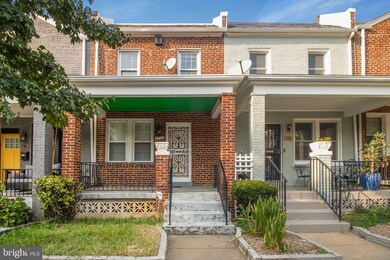
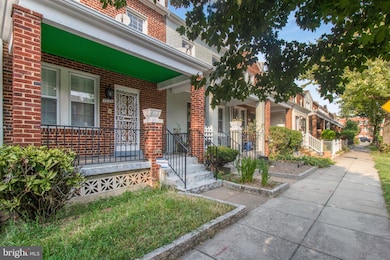
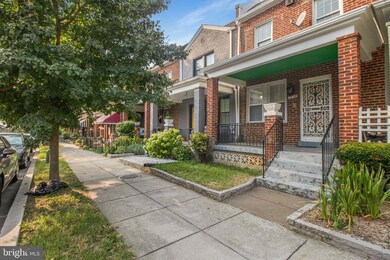

1758 Lang Place NE Washington, DC 20002
Langston Neighborhood
3
Beds
2
Baths
1,410
Sq Ft
1,232
Sq Ft Lot
Highlights
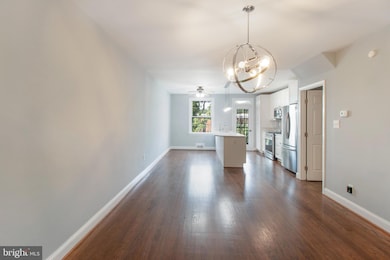
- Open Floorplan
- Wood Flooring
- Upgraded Countertops
- Colonial Architecture
- No HOA
- Stainless Steel Appliances
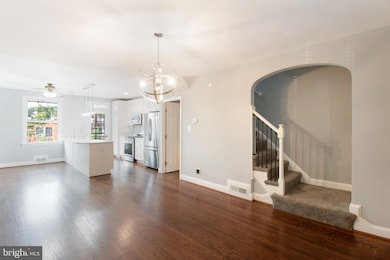
About This Home
As of March 2025Don’t miss this beautifully sold as-is updated 3-bedroom, 2 full bathroom home in DC located in the heart of the Trinidad neighborhood. Upon entering you will notice the wonderful wood floors and renovated kitchen. The kitchen features stainless steel appliances, new cabinetry, natural stone counters, and a large island that seats four. The main level's open floor plan is perfect for entertaining. Upstairs offers three bedrooms and a remodeled full bathroom. The basement has been fully renovated and offers an open multipurpose space and features a full bathroom with a walk-in shower. The backyard provides off-street parking. The wonderfully quiet block is within Stone's throw to Capitol Hill, transportation, the Union market district, and the H Street Corridor.
Townhouse Details
Home Type
- Townhome
Est. Annual Taxes
- $4,428
Year Built
- Built in 1940
Lot Details
- 1,232 Sq Ft Lot
- Infill Lot
Home Design
- Colonial Architecture
- Flat Roof Shape
- Brick Exterior Construction
- Brick Foundation
- Plaster Walls
Interior Spaces
- Property has 3 Levels
- Open Floorplan
- Recessed Lighting
- Wood Flooring
- Home Security System
Kitchen
- Galley Kitchen
- Gas Oven or Range
- Microwave
- Dishwasher
- Stainless Steel Appliances
- Upgraded Countertops
- Disposal
Bedrooms and Bathrooms
- 3 Bedrooms
- Bathtub with Shower
- Walk-in Shower
Laundry
- Dryer
- Washer
Finished Basement
- Heated Basement
- Interior and Exterior Basement Entry
- Laundry in Basement
Parking
- Driveway
- Off-Street Parking
Schools
- Eastern Senior High School
Utilities
- 90% Forced Air Heating and Cooling System
- Natural Gas Water Heater
- Public Septic
Listing and Financial Details
- Tax Lot 280
- Assessor Parcel Number 4471//0280
Community Details
Overview
- No Home Owners Association
- Carver Langston Subdivision
Pet Policy
- Limit on the number of pets
- Pet Deposit Required
Security
- Storm Doors
Map
Create a Home Valuation Report for This Property
The Home Valuation Report is an in-depth analysis detailing your home's value as well as a comparison with similar homes in the area
Home Values in the Area
Average Home Value in this Area
Property History
| Date | Event | Price | Change | Sq Ft Price |
|---|---|---|---|---|
| 03/06/2025 03/06/25 | Sold | $485,000 | -7.6% | $344 / Sq Ft |
| 01/29/2025 01/29/25 | Price Changed | $525,000 | +8.1% | $372 / Sq Ft |
| 12/12/2024 12/12/24 | Price Changed | $485,683 | -6.6% | $344 / Sq Ft |
| 08/20/2024 08/20/24 | Price Changed | $519,750 | -3.0% | $369 / Sq Ft |
| 08/16/2024 08/16/24 | Price Changed | $535,750 | -8.6% | $380 / Sq Ft |
| 07/11/2024 07/11/24 | Price Changed | $585,995 | +2.8% | $416 / Sq Ft |
| 06/21/2024 06/21/24 | Price Changed | $569,997 | -2.6% | $404 / Sq Ft |
| 06/04/2024 06/04/24 | Price Changed | $585,250 | -1.4% | $415 / Sq Ft |
| 05/29/2024 05/29/24 | For Sale | $593,450 | 0.0% | $421 / Sq Ft |
| 03/31/2022 03/31/22 | Rented | $2,500 | 0.0% | -- |
| 03/09/2022 03/09/22 | Under Contract | -- | -- | -- |
| 03/01/2022 03/01/22 | Price Changed | $2,500 | -10.7% | $2 / Sq Ft |
| 03/01/2022 03/01/22 | For Rent | $2,800 | 0.0% | -- |
| 02/28/2022 02/28/22 | Off Market | $2,800 | -- | -- |
| 02/02/2022 02/02/22 | Price Changed | $2,800 | -6.7% | $2 / Sq Ft |
| 12/08/2021 12/08/21 | Price Changed | $3,000 | -6.3% | $2 / Sq Ft |
| 12/03/2021 12/03/21 | Price Changed | $3,200 | -8.6% | $3 / Sq Ft |
| 10/09/2021 10/09/21 | For Rent | $3,500 | 0.0% | -- |
| 06/08/2021 06/08/21 | Off Market | $3,500 | -- | -- |
| 06/08/2021 06/08/21 | For Rent | $3,500 | -- | -- |
Source: Bright MLS
Tax History
| Year | Tax Paid | Tax Assessment Tax Assessment Total Assessment is a certain percentage of the fair market value that is determined by local assessors to be the total taxable value of land and additions on the property. | Land | Improvement |
|---|---|---|---|---|
| 2024 | $4,428 | $520,900 | $334,460 | $186,440 |
| 2023 | $4,285 | $504,160 | $334,320 | $169,840 |
| 2022 | $4,022 | $473,220 | $303,370 | $169,850 |
| 2021 | $3,775 | $444,060 | $292,530 | $151,530 |
| 2020 | $3,599 | $423,420 | $279,340 | $144,080 |
| 2019 | $3,311 | $389,480 | $259,450 | $130,030 |
| 2018 | $2,858 | $336,200 | $0 | $0 |
| 2017 | $2,641 | $310,650 | $0 | $0 |
| 2016 | $2,336 | $274,850 | $0 | $0 |
| 2015 | $1,980 | $232,920 | $0 | $0 |
| 2014 | $1,534 | $180,510 | $0 | $0 |
Source: Public Records
Mortgage History
| Date | Status | Loan Amount | Loan Type |
|---|---|---|---|
| Open | $460,750 | New Conventional | |
| Previous Owner | $370,000 | New Conventional | |
| Previous Owner | $100,000 | Unknown | |
| Previous Owner | $200,000 | Commercial |
Source: Public Records
Deed History
| Date | Type | Sale Price | Title Company |
|---|---|---|---|
| Deed | $485,000 | Westcor Land Title Insurance C | |
| Interfamily Deed Transfer | -- | None Available | |
| Interfamily Deed Transfer | -- | None Available |
Source: Public Records
Similar Homes in Washington, DC
Source: Bright MLS
MLS Number: DCDC2143908
APN: 4471-0280
Disclaimer: Certain information contained herein is derived from information provided by parties other than Homes.com. All information provided is deemed reliable, but is not guaranteed to be accurate and should be independently verified.
![]() The data relating to real estate for sale on this website appears in part through the BRIGHT Internet Data Exchange program, a voluntary cooperative exchange of property listing data between licensed real estate brokerage firms, and is provided by BRIGHT through a licensing agreement.
The data relating to real estate for sale on this website appears in part through the BRIGHT Internet Data Exchange program, a voluntary cooperative exchange of property listing data between licensed real estate brokerage firms, and is provided by BRIGHT through a licensing agreement.
Listing information is from various brokers who participate in the Bright MLS IDX program and not all listings may be visible on the site.
The property information being provided on or through the website is for the personal, non-commercial use of consumers and such information may not be used for any purpose other than to identify prospective properties consumers may be interested in purchasing.
Some properties which appear for sale on the website may no longer be available because they are for instance, under contract, sold or are no longer being offered for sale.
Property information displayed is deemed reliable but is not guaranteed.
Copyright 2025 Bright MLS, Inc.
Nearby Homes
- 1764 Lyman Place NE
- 1742 Lyman Place NE
- 1728 Lyman Place NE
- 1813 M St NE
- 1831 L St NE
- 1157 Summit St NE
- 1826 M St NE
- 1730 L St NE Unit 1
- 1171 Summit St NE
- 1701 M St NE Unit 1
- 1701 M St NE Unit 2
- 1026 18th St NE Unit PENTHOUSE 7
- 1026 18th St NE Unit 1
- 1019 18th St NE
- 1716 M St NE
- 1024 18th St NE
- 1643 Lang Place NE
- 1210 18th St NE
- 1140 1142 17th St NE
- 1140-1142 17th St NE