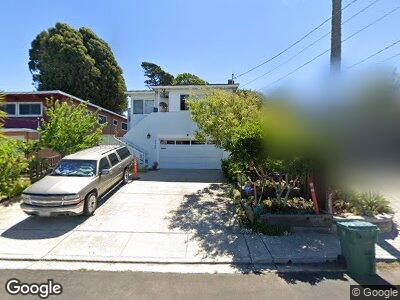
1764 Bayo Vista Ave San Pablo, CA 94806
Estimated Value: $681,000 - $902,000
4
Beds
3
Baths
1,614
Sq Ft
$470/Sq Ft
Est. Value
About This Home
This home is located at 1764 Bayo Vista Ave, San Pablo, CA 94806 and is currently estimated at $758,170, approximately $469 per square foot. 1764 Bayo Vista Ave is a home located in Contra Costa County with nearby schools including Riverside Elementary School, Betty Reid Soskin Middle School, and De Anza Senior High School.
Ownership History
Date
Name
Owned For
Owner Type
Purchase Details
Closed on
Dec 28, 2012
Sold by
Kahan Stan
Bought by
Reynoso Jose A
Current Estimated Value
Home Financials for this Owner
Home Financials are based on the most recent Mortgage that was taken out on this home.
Original Mortgage
$314,204
Outstanding Balance
$223,594
Interest Rate
3.27%
Mortgage Type
FHA
Estimated Equity
$535,632
Purchase Details
Closed on
Jun 28, 2012
Sold by
Mapps James
Bought by
Kahan Stan
Purchase Details
Closed on
May 22, 2002
Sold by
Mapps Patricia A
Bought by
Mapps James
Home Financials for this Owner
Home Financials are based on the most recent Mortgage that was taken out on this home.
Original Mortgage
$224,000
Interest Rate
6.94%
Mortgage Type
Purchase Money Mortgage
Create a Home Valuation Report for This Property
The Home Valuation Report is an in-depth analysis detailing your home's value as well as a comparison with similar homes in the area
Home Values in the Area
Average Home Value in this Area
Purchase History
| Date | Buyer | Sale Price | Title Company |
|---|---|---|---|
| Reynoso Jose A | $320,000 | Chicago Title Company | |
| Reynoso Jose A | -- | Chicago Title Company | |
| Kahan Stan | $200,000 | None Available | |
| Mapps James | $299,000 | First American Title Guarant |
Source: Public Records
Mortgage History
| Date | Status | Borrower | Loan Amount |
|---|---|---|---|
| Open | Reynoso Jose A | $314,204 | |
| Previous Owner | Mapps James | $224,000 |
Source: Public Records
Tax History Compared to Growth
Tax History
| Year | Tax Paid | Tax Assessment Tax Assessment Total Assessment is a certain percentage of the fair market value that is determined by local assessors to be the total taxable value of land and additions on the property. | Land | Improvement |
|---|---|---|---|---|
| 2024 | $6,013 | $386,321 | $144,868 | $241,453 |
| 2023 | $6,013 | $378,747 | $142,028 | $236,719 |
| 2022 | $5,925 | $371,322 | $139,244 | $232,078 |
| 2021 | $5,892 | $364,042 | $136,514 | $227,528 |
| 2019 | $5,569 | $353,246 | $132,466 | $220,780 |
| 2018 | $5,351 | $346,320 | $129,869 | $216,451 |
| 2017 | $5,217 | $339,530 | $127,323 | $212,207 |
| 2016 | $5,143 | $332,874 | $124,827 | $208,047 |
| 2015 | $5,118 | $327,874 | $122,952 | $204,922 |
| 2014 | $5,069 | $321,452 | $120,544 | $200,908 |
Source: Public Records
Map
Nearby Homes
- 1542 Beau Rivage
- 1675 Hillcrest Rd
- 2700 San Pablo Dam Rd
- 5815 N Arlington Blvd
- 5929 Harbor View Ave
- 2699 Vale Rd
- 1253 Gerald Ave
- 2882 Arundel Way
- 3536 Miflin Ave
- 2947 Brook Way
- 3563 San Pablo Dam Rd
- 10 Dove Ln
- 3706 Montera Ct
- 5841 Arlington Blvd
- 3060 Avon Ln
- 3718 Montera Ct
- 16 Las Moradas Cir
- 13 Quail Hill Ln
- 5955 Ralston Ave
- 2524 Moyers Rd