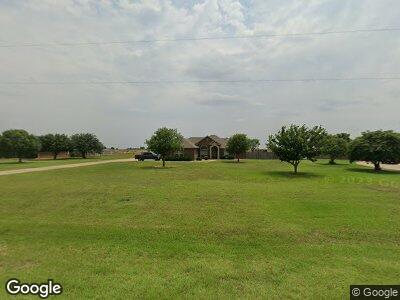
1764 Fm 1177 Wichita Falls, TX 76305
Estimated Value: $430,317 - $493,000
3
Beds
3
Baths
1,890
Sq Ft
$244/Sq Ft
Est. Value
About This Home
This home is located at 1764 Fm 1177, Wichita Falls, TX 76305 and is currently estimated at $461,659, approximately $244 per square foot. 1764 Fm 1177 is a home located in Wichita County with nearby schools including I.C. Evans Elementary School, Burkburnett Middle School, and Burkburnett High School.
Ownership History
Date
Name
Owned For
Owner Type
Purchase Details
Closed on
Oct 10, 2014
Sold by
Rogers Kaycie and Rogers Braylen
Bought by
Shafer William and Shafer Morgan
Current Estimated Value
Home Financials for this Owner
Home Financials are based on the most recent Mortgage that was taken out on this home.
Original Mortgage
$193,500
Interest Rate
4.13%
Mortgage Type
New Conventional
Purchase Details
Closed on
Aug 15, 2012
Sold by
Rogers Chadney and Rogers Leoandra E
Bought by
Rogers Kaycie and Rogers Braylen
Home Financials for this Owner
Home Financials are based on the most recent Mortgage that was taken out on this home.
Original Mortgage
$206,196
Interest Rate
3.25%
Mortgage Type
FHA
Purchase Details
Closed on
Nov 24, 2008
Sold by
Wood Danny Joe
Bought by
Rogers Chadney and Rogers Leoandra
Home Financials for this Owner
Home Financials are based on the most recent Mortgage that was taken out on this home.
Original Mortgage
$194,085
Interest Rate
5.99%
Mortgage Type
VA
Create a Home Valuation Report for This Property
The Home Valuation Report is an in-depth analysis detailing your home's value as well as a comparison with similar homes in the area
Home Values in the Area
Average Home Value in this Area
Purchase History
| Date | Buyer | Sale Price | Title Company |
|---|---|---|---|
| Shafer William | -- | None Available | |
| Rogers Kaycie | -- | Guarantee Title | |
| Rogers Chadney | -- | Guarantee Title |
Source: Public Records
Mortgage History
| Date | Status | Borrower | Loan Amount |
|---|---|---|---|
| Open | Shafer William | $197,000 | |
| Closed | Shafer William | $193,500 | |
| Previous Owner | Rogers Kaycie | $206,196 | |
| Previous Owner | Rogers Chadney | $194,085 |
Source: Public Records
Tax History Compared to Growth
Tax History
| Year | Tax Paid | Tax Assessment Tax Assessment Total Assessment is a certain percentage of the fair market value that is determined by local assessors to be the total taxable value of land and additions on the property. | Land | Improvement |
|---|---|---|---|---|
| 2024 | $6,457 | $392,774 | -- | -- |
| 2023 | $6,114 | $357,067 | $0 | $0 |
| 2022 | $6,169 | $324,606 | $0 | $0 |
| 2021 | $6,120 | $295,096 | $22,500 | $272,596 |
| 2020 | $5,766 | $273,028 | $21,000 | $252,028 |
| 2019 | $5,794 | $263,709 | $21,000 | $242,709 |
| 2018 | $1,620 | $246,523 | $21,000 | $225,523 |
| 2017 | $5,070 | $236,145 | $21,000 | $220,957 |
| 2016 | $4,609 | $214,677 | $21,000 | $193,677 |
| 2015 | -- | $210,101 | $21,000 | $189,101 |
| 2014 | -- | $210,201 | $0 | $0 |
Source: Public Records
Map
Nearby Homes
- 0 Perkins Rd
- 8121 Powell Rd
- Lot 13 Farm To Market Road 1177
- Lot 3 Farm To Market Road 1177
- Lot 6 Cashion Rd
- 8223 Tica Rd
- 0 Gilbert Rd
- 1425 Amherst St
- 1413 Parliament St
- 1419 Amherst St
- 1611 Sheppard Rd
- 1403 Amherst St
- 1609 Sheppard Rd
- 5 Friendship Trail
- TBD East Rd
- 3 Friendship Trail
- 1008 E Beverly Loop
- 1018 E Beverly Loop
- 1223 Amherst St
- 1301 Eleanor St