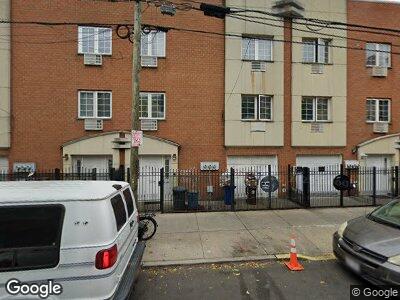
18-32 Linden St Ridgewood, NY 11385
Ridgewood NeighborhoodEstimated Value: $1,240,329 - $1,433,000
3
Beds
2
Baths
2,800
Sq Ft
$484/Sq Ft
Est. Value
About This Home
This home is located at 18-32 Linden St, Ridgewood, NY 11385 and is currently estimated at $1,355,082, approximately $483 per square foot. 18-32 Linden St is a home located in Queens County with nearby schools including Learners And Leaders, Joseph F. Quinn Intermediate School 77, and Grover Cleveland High School.
Ownership History
Date
Name
Owned For
Owner Type
Purchase Details
Closed on
Sep 17, 2021
Sold by
Gogarnoiu Nicolae
Bought by
Dumitru Gogarnoiu As Trustee and Melania Gogarnoiu As Trustee
Current Estimated Value
Purchase Details
Closed on
Dec 27, 2016
Sold by
Wong Edgardo and Wong Egardo
Bought by
Gogarnoiu Aurica and Gogarnoiu Nicolae
Purchase Details
Closed on
Sep 30, 2003
Sold by
Yan Jin Hua and Zhou Rong Sheng
Bought by
Wong Egardo and Wong Mary
Home Financials for this Owner
Home Financials are based on the most recent Mortgage that was taken out on this home.
Original Mortgage
$400,000
Interest Rate
6.01%
Mortgage Type
Purchase Money Mortgage
Purchase Details
Closed on
Jul 30, 2001
Sold by
Rega Const Corp
Bought by
Yan Jin Hua and Zhou Rong Sheng
Home Financials for this Owner
Home Financials are based on the most recent Mortgage that was taken out on this home.
Original Mortgage
$269,500
Interest Rate
7.06%
Create a Home Valuation Report for This Property
The Home Valuation Report is an in-depth analysis detailing your home's value as well as a comparison with similar homes in the area
Home Values in the Area
Average Home Value in this Area
Purchase History
| Date | Buyer | Sale Price | Title Company |
|---|---|---|---|
| Dumitru Gogarnoiu As Trustee | -- | -- | |
| Gogarnoiu Aurica | $1,060,000 | -- | |
| Wong Egardo | $555,000 | -- | |
| Yan Jin Hua | -- | -- |
Source: Public Records
Mortgage History
| Date | Status | Borrower | Loan Amount |
|---|---|---|---|
| Previous Owner | Wong Edgardo | $200,000 | |
| Previous Owner | Wong Edgardo | $50,000 | |
| Previous Owner | Wong Egardo | $400,000 | |
| Previous Owner | Yan Jin Hua | $269,500 | |
| Closed | Wong Egardo | $33,300 |
Source: Public Records
Tax History Compared to Growth
Tax History
| Year | Tax Paid | Tax Assessment Tax Assessment Total Assessment is a certain percentage of the fair market value that is determined by local assessors to be the total taxable value of land and additions on the property. | Land | Improvement |
|---|---|---|---|---|
| 2024 | $11,939 | $59,443 | $8,950 | $50,493 |
| 2023 | $11,696 | $58,234 | $7,461 | $50,773 |
| 2022 | $11,275 | $62,040 | $9,540 | $52,500 |
| 2021 | $11,213 | $59,520 | $9,540 | $49,980 |
| 2020 | $10,699 | $63,240 | $9,540 | $53,700 |
| 2019 | $10,362 | $69,660 | $9,540 | $60,120 |
| 2018 | $9,892 | $48,528 | $7,151 | $41,377 |
| 2017 | $9,294 | $47,064 | $7,597 | $39,467 |
| 2016 | $8,566 | $47,064 | $7,597 | $39,467 |
| 2015 | $5,165 | $42,120 | $9,928 | $32,192 |
| 2014 | $5,165 | $41,280 | $10,140 | $31,140 |
Source: Public Records
Map
Nearby Homes
- 614 Woodward Ave
- 1714 Gates Ave
- 1708 Linden St
- 1857 Woodbine St
- 1725 Menahan St
- 1708 Palmetto St
- 1823 Bleecker St
- 508 Onderdonk Ave
- 1830 Madison St
- 1665 Grove St
- 17-28 Greene Ave
- 1870 Harman St
- 253 St Nicholas Ave
- 251 St Nicholas Ave
- 20-25 Linden St
- 1693 Putnam Ave
- 1597 Gates Ave
- 1904 Harman St Unit TH1
- 1904 Harman St Unit 1 B
- 1904 Harman St Unit 3 B