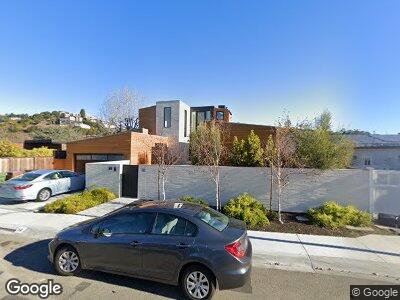
18 Peninsula Rd Belvedere Tiburon, CA 94920
Belvedere NeighborhoodEstimated Value: $4,335,000 - $5,415,742
4
Beds
3
Baths
2,382
Sq Ft
$2,056/Sq Ft
Est. Value
About This Home
This home is located at 18 Peninsula Rd, Belvedere Tiburon, CA 94920 and is currently estimated at $4,897,686, approximately $2,056 per square foot. 18 Peninsula Rd is a home located in Marin County with nearby schools including Reed Elementary School, Bel Aire Elementary School, and Del Mar Middle School.
Ownership History
Date
Name
Owned For
Owner Type
Purchase Details
Closed on
Jun 9, 2017
Sold by
Miller Geraldine F
Bought by
Miller Geraldine F
Current Estimated Value
Purchase Details
Closed on
Jun 19, 2014
Sold by
Colton Laurence Alan
Bought by
The Miller Trust and Miller Geraldine F
Home Financials for this Owner
Home Financials are based on the most recent Mortgage that was taken out on this home.
Original Mortgage
$1,600,000
Outstanding Balance
$564,354
Interest Rate
3.26%
Mortgage Type
New Conventional
Estimated Equity
$4,494,090
Purchase Details
Closed on
Dec 9, 1993
Sold by
Colton Jean Myers and Colton Laurence Alan
Bought by
Colton Jean Myers and Colton Laurence Alan
Home Financials for this Owner
Home Financials are based on the most recent Mortgage that was taken out on this home.
Original Mortgage
$550,000
Interest Rate
7.09%
Create a Home Valuation Report for This Property
The Home Valuation Report is an in-depth analysis detailing your home's value as well as a comparison with similar homes in the area
Home Values in the Area
Average Home Value in this Area
Purchase History
| Date | Buyer | Sale Price | Title Company |
|---|---|---|---|
| Miller Geraldine F | -- | None Available | |
| The Miller Trust | $2,487,500 | Old Republic Title Company | |
| Colton Jean Myers | -- | First American Title |
Source: Public Records
Mortgage History
| Date | Status | Borrower | Loan Amount |
|---|---|---|---|
| Open | The Miller Trust | $1,600,000 | |
| Previous Owner | Colton Jean Myers | $1,277,000 | |
| Previous Owner | Colton Jean Myers | $668,500 | |
| Previous Owner | Colton Jean Myers | $665,000 | |
| Previous Owner | Colton Jean Myers | $650,000 | |
| Previous Owner | Colton Jean Myers | $550,000 |
Source: Public Records
Tax History Compared to Growth
Tax History
| Year | Tax Paid | Tax Assessment Tax Assessment Total Assessment is a certain percentage of the fair market value that is determined by local assessors to be the total taxable value of land and additions on the property. | Land | Improvement |
|---|---|---|---|---|
| 2024 | $50,012 | $4,196,464 | $2,300,114 | $1,896,350 |
| 2023 | $48,954 | $4,114,193 | $2,255,022 | $1,859,171 |
| 2022 | $48,488 | $4,033,533 | $2,210,810 | $1,822,723 |
| 2021 | $47,750 | $3,954,468 | $2,167,479 | $1,786,989 |
| 2020 | $47,320 | $3,913,939 | $2,145,259 | $1,768,680 |
| 2019 | $46,461 | $3,837,210 | $2,103,210 | $1,734,000 |
| 2018 | $45,797 | $2,641,984 | $2,061,984 | $580,000 |
| 2017 | $26,650 | $2,031,856 | $2,006,856 | $25,000 |
| 2016 | $31,920 | $2,571,619 | $1,967,507 | $604,112 |
| 2015 | $31,972 | $2,533,003 | $1,937,962 | $595,041 |
| 2014 | $6,434 | $249,578 | $133,988 | $115,590 |
Source: Public Records
Map
Nearby Homes
- 26 Peninsula Rd
- 32 Peninsula Rd
- 96 Lagoon Rd
- 2 Beach Rd
- 13 Leeward Rd
- 329 San Rafael Ave
- 45 Bella Vista Ave
- 45 Harbor Oak Dr Unit 35
- 25 Corinthian Ct Unit 14
- 246 Bayview Ave
- 21 Lagoon Vista
- 3 Lagoon Vista
- 266 Bayview Ave
- 1720 Centro St W
- 121 Red Hill Cir
- 1837 Centro St W
- 1876 Centro St W
- 125 Belvedere Ave
- 135 Belvedere Ave
- 202 San Rafael Ave