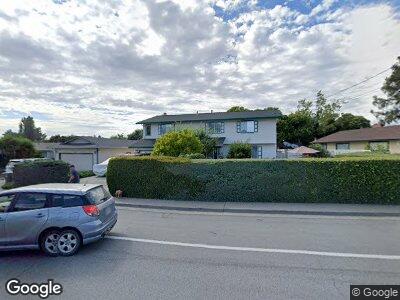
1801 Weaverly Dr Petaluma, CA 94954
Adobe NeighborhoodEstimated Value: $897,477 - $1,020,000
5
Beds
4
Baths
2,360
Sq Ft
$401/Sq Ft
Est. Value
About This Home
This home is located at 1801 Weaverly Dr, Petaluma, CA 94954 and is currently estimated at $946,119, approximately $400 per square foot. 1801 Weaverly Dr is a home located in Sonoma County with nearby schools including McDowell Elementary School, Petaluma Junior High School, and Petaluma High School.
Ownership History
Date
Name
Owned For
Owner Type
Purchase Details
Closed on
Dec 24, 2007
Sold by
Birchett Gregory B and Birchett Mary Jane
Bought by
Birchett Gregory B and Birchett Mary Jane
Current Estimated Value
Home Financials for this Owner
Home Financials are based on the most recent Mortgage that was taken out on this home.
Original Mortgage
$350,000
Interest Rate
5.12%
Mortgage Type
Stand Alone Refi Refinance Of Original Loan
Purchase Details
Closed on
Feb 13, 2004
Sold by
Birchett Gregory B and Birchett Mary Jane
Bought by
Birchett Gregory B and Birchett Mary Jane
Home Financials for this Owner
Home Financials are based on the most recent Mortgage that was taken out on this home.
Original Mortgage
$231,800
Interest Rate
5.12%
Mortgage Type
Unknown
Create a Home Valuation Report for This Property
The Home Valuation Report is an in-depth analysis detailing your home's value as well as a comparison with similar homes in the area
Home Values in the Area
Average Home Value in this Area
Purchase History
| Date | Buyer | Sale Price | Title Company |
|---|---|---|---|
| Birchett Gregory B | -- | First American Title Ins Co | |
| Birchett Gregory B | -- | First American Title Ins Co | |
| Birchett Gregory B | -- | -- |
Source: Public Records
Mortgage History
| Date | Status | Borrower | Loan Amount |
|---|---|---|---|
| Closed | Birchett Gregory B | $350,000 | |
| Closed | Birchett Gregory B | $350,000 | |
| Closed | Birchett Gregory B | $150,000 | |
| Closed | Birchett Gregory | $231,800 | |
| Closed | Birchett Gregory B | $185,000 | |
| Closed | Birchett Gregory | $148,000 | |
| Closed | Birchett Gregory | $50,000 | |
| Closed | Birchett Gregory | $155,000 |
Source: Public Records
Tax History Compared to Growth
Tax History
| Year | Tax Paid | Tax Assessment Tax Assessment Total Assessment is a certain percentage of the fair market value that is determined by local assessors to be the total taxable value of land and additions on the property. | Land | Improvement |
|---|---|---|---|---|
| 2023 | $3,463 | $302,050 | $84,436 | $217,614 |
| 2022 | $3,305 | $296,129 | $82,781 | $213,348 |
| 2021 | $3,243 | $290,323 | $81,158 | $209,165 |
| 2020 | $3,269 | $287,347 | $80,326 | $207,021 |
| 2019 | $3,229 | $281,713 | $78,751 | $202,962 |
| 2018 | $3,215 | $276,190 | $77,207 | $198,983 |
| 2017 | $3,148 | $270,776 | $75,694 | $195,082 |
| 2016 | $3,068 | $265,467 | $74,210 | $191,257 |
| 2015 | $3,025 | $261,481 | $73,096 | $188,385 |
| 2014 | $3,010 | $256,360 | $71,665 | $184,695 |
Source: Public Records
Map
Nearby Homes
- 649 Ely Blvd S
- 524 Ely Blvd S
- 1645 Weaverly Dr
- 742 Bordeaux Dr
- 801 Crinella Dr
- 11 Persimmon Ct
- 1464 Mcgregor Ave
- 69 Eastside Cir
- 1425 Weaverly Dr
- 2104 Marylyn Cir
- 1403 Marylyn Cir
- 1412 Ivy Ln
- 1304 Mcgregor Ave
- 1305 Lombardi Ave
- 394 Dove Ln
- 714 Carlin Ct
- 410 Stuart Dr
- 1262 Pacific Ave
- 1119 Clelia Ct
- 840 Sprucewood Ct