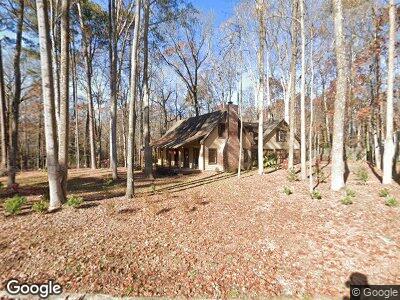
181 North Trace Alpharetta, GA 30009
Estimated Value: $652,000 - $816,000
3
Beds
3
Baths
1,315
Sq Ft
$568/Sq Ft
Est. Value
About This Home
This home is located at 181 North Trace, Alpharetta, GA 30009 and is currently estimated at $746,907, approximately $567 per square foot. 181 North Trace is a home located in Fulton County with nearby schools including Alpharetta Elementary School, Hopewell Middle School, and Cambridge High School.
Ownership History
Date
Name
Owned For
Owner Type
Purchase Details
Closed on
Jun 21, 2021
Sold by
Webb Larry Todd
Bought by
Webb Larry Todd and Webb Elizabeth Ann
Current Estimated Value
Home Financials for this Owner
Home Financials are based on the most recent Mortgage that was taken out on this home.
Original Mortgage
$180,000
Outstanding Balance
$165,780
Interest Rate
2.9%
Mortgage Type
New Conventional
Estimated Equity
$539,845
Purchase Details
Closed on
Mar 26, 2007
Sold by
Webb Cathaleene D J
Bought by
Webb Larry T
Home Financials for this Owner
Home Financials are based on the most recent Mortgage that was taken out on this home.
Original Mortgage
$200,000
Interest Rate
6.11%
Mortgage Type
Stand Alone Second
Create a Home Valuation Report for This Property
The Home Valuation Report is an in-depth analysis detailing your home's value as well as a comparison with similar homes in the area
Home Values in the Area
Average Home Value in this Area
Purchase History
| Date | Buyer | Sale Price | Title Company |
|---|---|---|---|
| Webb Larry Todd | -- | -- | |
| Webb Larry T | -- | -- |
Source: Public Records
Mortgage History
| Date | Status | Borrower | Loan Amount |
|---|---|---|---|
| Open | Webb Larry Todd | $180,000 | |
| Previous Owner | Webb Larry Todd | $300,000 | |
| Previous Owner | Webb Larry T | $100,000 | |
| Previous Owner | Webb Larry T | $200,000 | |
| Previous Owner | Webb C Diane J | $40,000 |
Source: Public Records
Tax History Compared to Growth
Tax History
| Year | Tax Paid | Tax Assessment Tax Assessment Total Assessment is a certain percentage of the fair market value that is determined by local assessors to be the total taxable value of land and additions on the property. | Land | Improvement |
|---|---|---|---|---|
| 2023 | $4,920 | $174,320 | $63,520 | $110,800 |
| 2022 | $2,064 | $134,800 | $38,840 | $95,960 |
| 2021 | $2,353 | $121,960 | $29,840 | $92,120 |
| 2020 | $2,355 | $113,600 | $34,960 | $78,640 |
| 2019 | $316 | $115,040 | $20,600 | $94,440 |
| 2018 | $2,543 | $112,360 | $20,120 | $92,240 |
| 2017 | $1,987 | $80,040 | $23,520 | $56,520 |
| 2016 | $1,985 | $80,040 | $23,520 | $56,520 |
| 2015 | $2,253 | $80,040 | $23,520 | $56,520 |
| 2014 | $1,220 | $52,560 | $15,440 | $37,120 |
Source: Public Records
Map
Nearby Homes