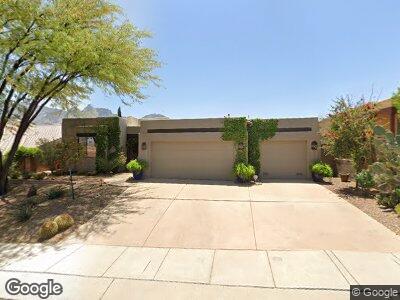
1810 E Starmist Place Tucson, AZ 85737
Carolina Shadows Estates NeighborhoodEstimated Value: $451,174 - $567,000
--
Bed
2
Baths
1,980
Sq Ft
$269/Sq Ft
Est. Value
About This Home
This home is located at 1810 E Starmist Place, Tucson, AZ 85737 and is currently estimated at $531,794, approximately $268 per square foot. 1810 E Starmist Place is a home located in Pima County with nearby schools including Painted Sky Elementary School, Ironwood Ridge High School, and BASIS Oro Valley.
Ownership History
Date
Name
Owned For
Owner Type
Purchase Details
Closed on
Jun 2, 2022
Sold by
Hunsperger John L and Hunsperger Catherine P
Bought by
Hunsperger Family Living Trust
Current Estimated Value
Home Financials for this Owner
Home Financials are based on the most recent Mortgage that was taken out on this home.
Original Mortgage
$100,000
Outstanding Balance
$96,603
Interest Rate
5.27%
Mortgage Type
Credit Line Revolving
Estimated Equity
$421,525
Purchase Details
Closed on
Dec 29, 2020
Sold by
Hunsperger John L and Hunsperger Cathy P
Bought by
Hunsperger John L and Hunsperger Catherine P
Purchase Details
Closed on
May 11, 1998
Sold by
Chicago Title Insurance Company
Bought by
High Desert Homes Inc
Purchase Details
Closed on
May 8, 1998
Sold by
High Desert Homes Inc
Bought by
Hunsperger John L and Hunsperger Cathy P
Create a Home Valuation Report for This Property
The Home Valuation Report is an in-depth analysis detailing your home's value as well as a comparison with similar homes in the area
Home Values in the Area
Average Home Value in this Area
Purchase History
| Date | Buyer | Sale Price | Title Company |
|---|---|---|---|
| Hunsperger Family Living Trust | -- | None Listed On Document | |
| Hunsperger John L | -- | None Listed On Document | |
| Hunsperger John L | -- | None Available | |
| High Desert Homes Inc | $50,676 | -- | |
| Hunsperger John L | $55,000 | -- |
Source: Public Records
Mortgage History
| Date | Status | Borrower | Loan Amount |
|---|---|---|---|
| Open | Hunsperger Family Living Trust | $100,000 | |
| Previous Owner | Hunsperger John L | $100,000 | |
| Previous Owner | Hunsperger John L | $117,500 | |
| Previous Owner | Hunsperger John L | $120,500 |
Source: Public Records
Tax History Compared to Growth
Tax History
| Year | Tax Paid | Tax Assessment Tax Assessment Total Assessment is a certain percentage of the fair market value that is determined by local assessors to be the total taxable value of land and additions on the property. | Land | Improvement |
|---|---|---|---|---|
| 2024 | $3,811 | $31,744 | -- | -- |
| 2023 | $3,811 | $30,233 | $0 | $0 |
| 2022 | $3,628 | $28,793 | $0 | $0 |
| 2021 | $3,671 | $26,753 | $0 | $0 |
| 2020 | $3,611 | $26,753 | $0 | $0 |
| 2019 | $3,497 | $26,377 | $0 | $0 |
| 2018 | $3,347 | $23,110 | $0 | $0 |
| 2017 | $3,283 | $23,110 | $0 | $0 |
| 2016 | $3,055 | $22,260 | $0 | $0 |
| 2015 | $2,970 | $21,200 | $0 | $0 |
Source: Public Records
Map
Nearby Homes
- 1725 E Ganymede Dr
- 1794 E Moonshroud Dr
- 11916 N Meteor Place
- 11948 N Meteor Place
- 1978 E Palisades Rd
- 1511 E Triton Place
- 11892 N Labyrinth Dr
- 11924 N Labyrinth Dr
- 1321 E Volans Place
- 11450 N Charoleau Dr
- 11928 N Silver Vista Place
- 11858 N Silver Village Place
- 1093 E Silver Ray Dr
- 11873 N Silver Desert Dr
- 11656 N Silverwood Dr
- 11465 N Village Canyon Place
- 11315 N Mountain Meadow Place
- 831 E Strada Patania
- 811 E Strada Patania
- 2221 E Stone Stable Dr