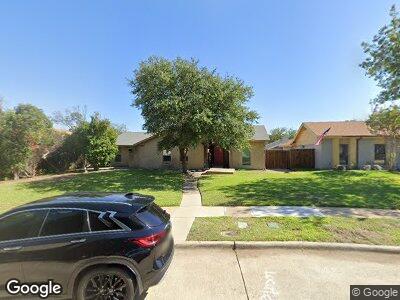
1812 Dawn Cir Richardson, TX 75081
Berkner Park NeighborhoodEstimated Value: $399,000 - $454,000
3
Beds
2
Baths
2,118
Sq Ft
$198/Sq Ft
Est. Value
About This Home
This home is located at 1812 Dawn Cir, Richardson, TX 75081 and is currently estimated at $419,555, approximately $198 per square foot. 1812 Dawn Cir is a home located in Dallas County with nearby schools including Springridge Elementary School, Liberty Junior High School, and Berkner High School.
Ownership History
Date
Name
Owned For
Owner Type
Purchase Details
Closed on
Mar 23, 2024
Sold by
Kordsmeier Richard A
Bought by
Richard A Kordsmeier Revocable Trust and Kordsmeier
Current Estimated Value
Purchase Details
Closed on
Nov 23, 2015
Sold by
John Young Construction Company
Bought by
Saric Amela
Home Financials for this Owner
Home Financials are based on the most recent Mortgage that was taken out on this home.
Original Mortgage
$181,649
Interest Rate
3.88%
Mortgage Type
FHA
Purchase Details
Closed on
Apr 14, 2015
Sold by
Mcelroy Jennifer Jan
Bought by
John Young Construction Company
Purchase Details
Closed on
Jun 13, 2014
Sold by
Hopkins Toni Elaine and Johnson Teri Ellen Hopkins
Bought by
Mcelroy Jennifer Jan
Purchase Details
Closed on
Feb 2, 2008
Sold by
Hopkins Betty Jean and Hopkins Robert Jesse
Bought by
Hopkins Robert Jesse and Hopkins Robert J
Create a Home Valuation Report for This Property
The Home Valuation Report is an in-depth analysis detailing your home's value as well as a comparison with similar homes in the area
Home Values in the Area
Average Home Value in this Area
Purchase History
| Date | Buyer | Sale Price | Title Company |
|---|---|---|---|
| Richard A Kordsmeier Revocable Trust | -- | None Listed On Document | |
| Saric Amela | -- | Chicago Title | |
| John Young Construction Company | -- | None Available | |
| Mcelroy Jennifer Jan | -- | Accommodation | |
| Hopkins Toni Elaine | -- | Accommodation |
Source: Public Records
Mortgage History
| Date | Status | Borrower | Loan Amount |
|---|---|---|---|
| Previous Owner | Kordsmeier Richard A | $250,000 | |
| Previous Owner | Saric Amela | $181,649 |
Source: Public Records
Tax History Compared to Growth
Tax History
| Year | Tax Paid | Tax Assessment Tax Assessment Total Assessment is a certain percentage of the fair market value that is determined by local assessors to be the total taxable value of land and additions on the property. | Land | Improvement |
|---|---|---|---|---|
| 2023 | $3,306 | $312,740 | $90,000 | $222,740 |
| 2022 | $7,647 | $312,740 | $90,000 | $222,740 |
| 2021 | $6,543 | $249,490 | $60,000 | $189,490 |
| 2020 | $6,661 | $249,490 | $60,000 | $189,490 |
| 2019 | $6,462 | $230,640 | $55,000 | $175,640 |
| 2018 | $5,762 | $215,640 | $40,000 | $175,640 |
| 2017 | $4,822 | $180,590 | $40,000 | $140,590 |
| 2016 | $4,031 | $150,970 | $30,000 | $120,970 |
| 2015 | $3,901 | $150,970 | $30,000 | $120,970 |
| 2014 | $3,901 | $147,830 | $30,000 | $117,830 |
Source: Public Records
Map
Nearby Homes
- 1804 University Dr
- 1908 University Dr
- 1806 Serenade Ln
- 1911 Marquette Dr
- 1802 Centenary Dr
- 1618 University Dr
- 201 Trailridge Dr
- 1711 Windsong Trail
- 303 Trailridge Dr
- 145 Trellis Place Unit 145
- 140 N Spring Creek Dr
- 2111 E Belt Line Rd Unit 174C
- 1615 Centenary Dr
- 208 Gold Finch Dr
- 2244 Village Dr N Unit 2244
- 208 Village Dr N
- 210 Hemlock Dr
- 1607 Centenary Dr
- 1907 E Spring Valley Rd
- 7 Harolds Cir