1813 Broken Bend Dr Westlake, TX 76262
Westlake NeighborhoodEstimated Value: $2,583,000 - $3,787,000
5
Beds
6
Baths
6,879
Sq Ft
$460/Sq Ft
Est. Value
About This Home
This home is located at 1813 Broken Bend Dr, Westlake, TX 76262 and is currently estimated at $3,165,056, approximately $460 per square foot. 1813 Broken Bend Dr is a home located in Tarrant County with nearby schools including Walnut Grove Elementary School, Don T. Durham Intermediate School, and Carroll Middle School.
Ownership History
Date
Name
Owned For
Owner Type
Purchase Details
Closed on
Jun 17, 2008
Sold by
Ward Bonnie S
Bought by
Still Jay P and Still Jana J
Current Estimated Value
Home Financials for this Owner
Home Financials are based on the most recent Mortgage that was taken out on this home.
Original Mortgage
$417,000
Interest Rate
6.05%
Mortgage Type
Purchase Money Mortgage
Purchase Details
Closed on
Mar 15, 2004
Sold by
Welker Patrick L and Welker Mary Jane M
Bought by
Ward David L and Ward Bonnie S
Purchase Details
Closed on
Aug 3, 2001
Sold by
John Kelly Custom Homes Inc
Bought by
Welker Patrick L and Welker Mary Jane M
Home Financials for this Owner
Home Financials are based on the most recent Mortgage that was taken out on this home.
Original Mortgage
$699,950
Interest Rate
7.07%
Purchase Details
Closed on
May 24, 2000
Sold by
Glenwyck Farms Ltd
Bought by
John Kelly Custom Homes Inc
Home Financials for this Owner
Home Financials are based on the most recent Mortgage that was taken out on this home.
Original Mortgage
$960,000
Interest Rate
8.14%
Mortgage Type
Construction
Create a Home Valuation Report for This Property
The Home Valuation Report is an in-depth analysis detailing your home's value as well as a comparison with similar homes in the area
Home Values in the Area
Average Home Value in this Area
Purchase History
| Date | Buyer | Sale Price | Title Company |
|---|---|---|---|
| Still Jay P | -- | Hexter Fair Title Company | |
| Ward David L | -- | Stewart Title | |
| Welker Patrick L | -- | American Title Co | |
| John Kelly Custom Homes Inc | -- | American Title Co |
Source: Public Records
Mortgage History
| Date | Status | Borrower | Loan Amount |
|---|---|---|---|
| Open | Still Jay P | $300,000 | |
| Closed | Still Jay P | $417,000 | |
| Previous Owner | Still Jay P | $417,000 | |
| Previous Owner | Welker Patrick L | $705,500 | |
| Previous Owner | Welker Patrick L | $699,950 | |
| Previous Owner | John Kelly Custom Homes Inc | $960,000 |
Source: Public Records
Tax History Compared to Growth
Tax History
| Year | Tax Paid | Tax Assessment Tax Assessment Total Assessment is a certain percentage of the fair market value that is determined by local assessors to be the total taxable value of land and additions on the property. | Land | Improvement |
|---|---|---|---|---|
| 2024 | $30,449 | $2,089,647 | $477,720 | $1,611,927 |
| 2023 | $33,388 | $2,497,064 | $477,720 | $2,019,344 |
| 2022 | $35,686 | $2,362,438 | $335,600 | $2,026,838 |
| 2021 | $33,723 | $1,818,522 | $335,600 | $1,482,922 |
| 2020 | $30,746 | $1,554,657 | $379,080 | $1,175,577 |
| 2019 | $29,066 | $1,364,264 | $379,080 | $985,184 |
| 2018 | $30,486 | $1,468,633 | $379,080 | $1,089,553 |
| 2017 | $30,894 | $1,434,533 | $210,600 | $1,223,933 |
| 2016 | $30,413 | $1,412,205 | $252,720 | $1,159,485 |
| 2015 | $30,601 | $1,589,000 | $160,000 | $1,429,000 |
| 2014 | $30,601 | $1,589,000 | $160,000 | $1,429,000 |
Source: Public Records
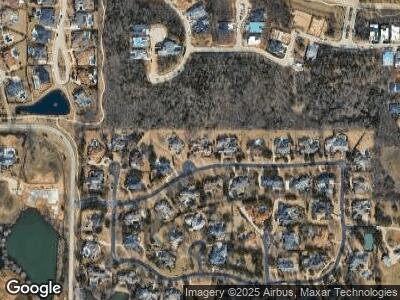
Map
Nearby Homes
- 1805 Millstream Ct
- 2112 Ainsley Ct
- 1828 Broken Bend Dr
- 1518 Winsbury Way
- 1802 Scenic Cir
- 1855 Broken Bend Dr
- 2119 Ascension Trail
- 1498 Forest Knoll Dr
- TBD Whitwood Cove
- 2001 Cordoba Cove
- 2012 Whitwood Cove
- 2020 Whitwood Cove
- 2024 Whitwood Cove
- 2029 Valencia Cove
- 1712 Oak Glen Ln
- 1708 Oak Glen Ln
- 1621 Meandering Way Dr
- 61 Cortes Dr
- 76 Cortes Dr
- 74 Cortes Dr