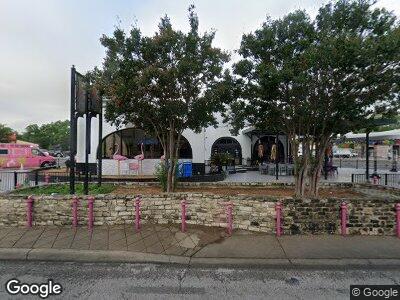
1815 Fredericksburg Rd San Antonio, TX 78201
Jefferson Neighborhood
--
Bed
--
Bath
2,907
Sq Ft
8,712
Sq Ft Lot
About This Home
This home is located at 1815 Fredericksburg Rd, San Antonio, TX 78201. 1815 Fredericksburg Rd is a home located in Bexar County with nearby schools including Thomas Jefferson High School, Woodlawn Academy, and Young Women's Leadership Academy.
Ownership History
Date
Name
Owned For
Owner Type
Purchase Details
Closed on
Mar 1, 2022
Sold by
Offspring Capital Investments Llc
Bought by
Biodec Llc
Home Financials for this Owner
Home Financials are based on the most recent Mortgage that was taken out on this home.
Original Mortgage
$1,000,000
Outstanding Balance
$943,842
Interest Rate
3.69%
Mortgage Type
New Conventional
Purchase Details
Closed on
Sep 22, 2017
Sold by
Pizana Jesus A
Bought by
Holmes Cay Llc and Holmes Cay Llc
Home Financials for this Owner
Home Financials are based on the most recent Mortgage that was taken out on this home.
Original Mortgage
$428,468
Interest Rate
3.89%
Mortgage Type
Commercial
Purchase Details
Closed on
Oct 13, 2006
Sold by
Capistrano Enterprises Inc
Bought by
Pizana Jesus A
Home Financials for this Owner
Home Financials are based on the most recent Mortgage that was taken out on this home.
Original Mortgage
$170,000
Interest Rate
6.41%
Mortgage Type
Purchase Money Mortgage
Purchase Details
Closed on
Mar 30, 2000
Sold by
Pizana Maria Delourdes
Bought by
Capistrano Enterprises Inc
Create a Home Valuation Report for This Property
The Home Valuation Report is an in-depth analysis detailing your home's value as well as a comparison with similar homes in the area
Home Values in the Area
Average Home Value in this Area
Purchase History
| Date | Buyer | Sale Price | Title Company |
|---|---|---|---|
| Holmes Cay Llc | -- | Alamo Title Co | |
| Pizana Jesus A | -- | None Available | |
| Capistrano Enterprises Inc | -- | -- |
Source: Public Records
Mortgage History
| Date | Status | Borrower | Loan Amount |
|---|---|---|---|
| Closed | Holmes Cay Llc | $428,468 | |
| Previous Owner | Pizana Jesus A | $170,000 |
Source: Public Records
Tax History Compared to Growth
Tax History
| Year | Tax Paid | Tax Assessment Tax Assessment Total Assessment is a certain percentage of the fair market value that is determined by local assessors to be the total taxable value of land and additions on the property. | Land | Improvement |
|---|---|---|---|---|
| 2023 | $13,762 | $495,000 | $112,240 | $382,760 |
| 2022 | $13,086 | $482,940 | $90,070 | $392,870 |
| 2021 | $12,806 | $458,380 | $78,280 | $380,100 |
| 2020 | $12,913 | $442,430 | $78,280 | $364,150 |
| 2019 | $12,680 | $442,430 | $76,730 | $365,700 |
| 2018 | $12,184 | $429,370 | $73,080 | $356,290 |
| 2017 | $11,233 | $398,000 | $73,080 | $324,920 |
| 2016 | $12,119 | $429,370 | $73,080 | $356,290 |
| 2015 | $9,493 | $419,320 | $73,080 | $346,240 |
| 2014 | $9,493 | $350,840 | $0 | $0 |
Source: Public Records
Map
Nearby Homes
- 1731 W Kings Hwy
- 1619 W Kings Hwy
- 1735 W Gramercy Place
- 3216 N Elmendorf St
- 1734 W Kings Hwy
- 3214 N Elmendorf St
- 102 Beal
- 1614 W Kings Hwy
- 1538 W Gramercy Place
- 1502 W Rosewood Ave
- 1643 W Rosewood Ave
- 1635 W Mulberry Ave
- 1848 W Gramercy Place
- 1726 W Mulberry Ave
- 1547 W Agarita Ave
- 1435 W Rosewood Ave
- 1750 W Mulberry Ave
- 1825 W Mulberry Ave
- 1915 W Gramercy Place
- 1707 W Huisache Ave