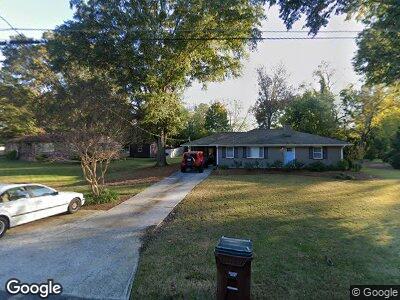
182 Brooke Dr Unit 182 Alpharetta, GA 30009
Estimated Value: $681,000 - $918,640
3
Beds
2
Baths
1,320
Sq Ft
$615/Sq Ft
Est. Value
About This Home
This home is located at 182 Brooke Dr Unit 182, Alpharetta, GA 30009 and is currently estimated at $811,910, approximately $615 per square foot. 182 Brooke Dr Unit 182 is a home located in Fulton County with nearby schools including Alpharetta Elementary School, Hopewell Middle School, and Cambridge High School.
Ownership History
Date
Name
Owned For
Owner Type
Purchase Details
Closed on
Apr 16, 2024
Sold by
Sullivan Shannon A
Bought by
Sullivan Andrew R and Sullivan Shannon A
Current Estimated Value
Home Financials for this Owner
Home Financials are based on the most recent Mortgage that was taken out on this home.
Original Mortgage
$500,000
Outstanding Balance
$384,462
Interest Rate
6.87%
Mortgage Type
New Conventional
Estimated Equity
$427,448
Purchase Details
Closed on
Mar 19, 2021
Sold by
Brooks Gary
Bought by
Sullivan Shannon A and Sullivan Andrew R
Home Financials for this Owner
Home Financials are based on the most recent Mortgage that was taken out on this home.
Original Mortgage
$440,000
Interest Rate
2.8%
Mortgage Type
New Conventional
Purchase Details
Closed on
Mar 10, 2015
Sold by
Barrett David S
Bought by
Brooks Gary
Create a Home Valuation Report for This Property
The Home Valuation Report is an in-depth analysis detailing your home's value as well as a comparison with similar homes in the area
Home Values in the Area
Average Home Value in this Area
Purchase History
| Date | Buyer | Sale Price | Title Company |
|---|---|---|---|
| Sullivan Andrew R | -- | -- | |
| Sullivan Shannon A | $550,000 | -- | |
| Brooks Gary | $165,000 | -- |
Source: Public Records
Mortgage History
| Date | Status | Borrower | Loan Amount |
|---|---|---|---|
| Open | Sullivan Andrew R | $500,000 | |
| Previous Owner | Sullivan Shannon A | $440,000 | |
| Previous Owner | Sullivan Shannon A | $440,000 | |
| Previous Owner | Barrett David S | $6,000 | |
| Previous Owner | Whittington Jennifer | $24,000 |
Source: Public Records
Tax History Compared to Growth
Tax History
| Year | Tax Paid | Tax Assessment Tax Assessment Total Assessment is a certain percentage of the fair market value that is determined by local assessors to be the total taxable value of land and additions on the property. | Land | Improvement |
|---|---|---|---|---|
| 2023 | $7,006 | $221,200 | $115,200 | $106,000 |
| 2022 | $5,788 | $220,000 | $102,080 | $117,920 |
| 2021 | $4,122 | $125,360 | $37,440 | $87,920 |
| 2020 | $5,588 | $166,600 | $118,440 | $48,160 |
| 2019 | $529 | $91,960 | $31,440 | $60,520 |
| 2018 | $2,535 | $89,800 | $30,680 | $59,120 |
| 2017 | $1,926 | $66,000 | $23,520 | $42,480 |
| 2016 | $1,926 | $66,000 | $23,520 | $42,480 |
| 2015 | $1,730 | $49,360 | $17,600 | $31,760 |
| 2014 | $1,513 | $49,360 | $17,600 | $31,760 |
Source: Public Records